![]() 4.8 Rating (best institute to learn data analytics course)
4.8 Rating (best institute to learn data analytics course)
Learn Data Analytics Course with Certification in Hyderabad
100% Job Placements Guaranteed | 25+ Hiring Partners | Internship Opportunity
Master the most in-demand skills in the field of Data Analytics with WhiteScholars Academy — Hyderabad's top training institute for data analytics course.
Launch Your Data Analytics Career with WhiteScholars and explore expert-led topics designed to equip you with in-demand skills like tableau, PowerBi, Matplotlib, Pandas, Excel and more. Become a certified data analyst in 6 months with dual certification.
In association with:
Guaranteed Internship with:

Course Highlights


Awarded by Telangana Higher Education as Emerging EdTech of India
Book a Free Demo Now
Become a Cerified Digital Marketer in Just 3 Months!
Enroll Now To Get 5% Instant Discount
Key Outcomes
Build a strong foundation in data analysis principles.
Master Data Analytics Skills: Tableau, SQL, Power BI, Matpotlib, Pandas, Statistics, Excel, and Jupyter Notebook.
A dedicated placement cell for the participants who completed the course along with career counselling services. Guaranteed placement support with our career counselling services
Work on real-time projects and complete the assignments
Earn a professional certificate in data analytics and become a job-ready candidate during the course tenure and get tips to prepare for job interviews along with resume-building advice.

Data Analytics Industry Trends
The global data analytics market size is estimated at USD 50.04 billion in 2024 and is anticipated to reach around USD 658.64 billion by 2034, expanding at a CAGR of 29.40% from 2024 to 2034.
Source: LinkedIn
Source: Precedence Research
Why Join This Course?
- Master In-Demand Skills: Gain practical knowledge and hands-on experience on Power BI, Tableau, SQL, Pandas, Matpotlib, Excel, and Jupyter Notebook.
- Expert-Led Training: Learn from seasoned professionals and mentors with real-world experience.
- Hands-on Learning: Learn 7 data analysis tools, and get 4 industry-relevant projects.
- Flexible Learning Options: Access online and offline sessions designed to fit your schedule, making it easy to balance learning with other commitments.
- Course Certification: Earn a recognized certification that adds value to your resume and enhances your employability.
- Job-Ready Curriculum: Get real-life case studies, practical projects, and cutting-edge tools that prepare you for the job interviews.
- Guaranteed Placements: 98% of our students get placed at company placements.
- Live Classes: Attend Live interactive sessions across 6 months of core training program
- Comprehensive Support: Receive dedicated guidance through personalized feedback, and career counseling.
Who is Eligible to Learn Data Analytics Course?
The Data Analytics Program is designed to meet the needs of a wide range of learners, whether you’re just starting out or looking to take your career to the next level. It’s perfect for individuals from various backgrounds who share a passion for working with data and solving real-world problems using analytical approaches.
-
Graduates and Students
-
Working Professionals
-
Freshers With Logical Skills
-
Career Swappers
-
Finance and Accounting Professionals
-
Anyone Curious Data & Analytics
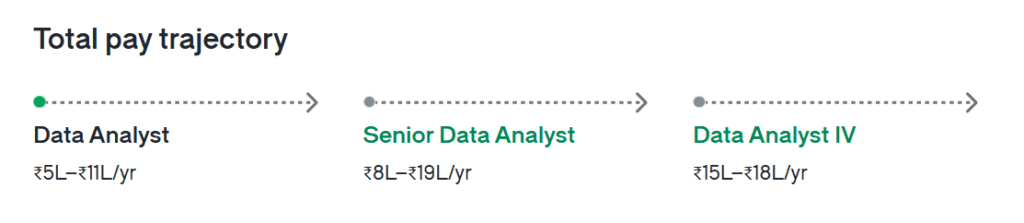
What are the different job roles for Data Analytics Course?
Our Scholars Work At

Program Highlights

Top Notch Faculty
Learn from Industry experts who are working as senior data scientists with 12+ years of experience
Network of 25+ hiring managers
A network of hiring managers to build strong relationships with companies seeking qualified candidates
Customized capstone projects
Allows students to tailor their learning experience to their specific career goals
Industry focused curriculum
Industry ready curriculum built in collaboration with hiring manager to fulfill the industry needsOur Scholars - Placed at Leading Companies

Tools You Will Learn

Tableau

MatPlotLib

PowerBi

Pandas

Excel
SQL

Jupyter Notebook

Best Data Analytics Course Certifications

Get certification after completion
of your course


Get certification after completion

Get certification after completion
of your internship with us
Our Data Analytics Projects

Finance Dashboard (Excel)
Creating a finance dashboard using Excel in data analytics involves organizing and visualizing financial data to provide clear insights into key metrics such as revenue, expenses, profit margins, and cash flow. By utilizing Excel’s functions, pivot tables, and charting tools, users can build interactive dashboards that offer a comprehensive view of financial performance. These dashboards can display real-time data, track KPIs, and generate customized reports for decision-makers. A well-designed finance dashboard helps businesses monitor trends, identify areas for improvement, and make data-driven financial decisions efficiently.

Covid Database (Tableau / PowerBI)
Creating a COVID-19 database dashboard using Tableau or Power BI involves visualizing pandemic-related data to track key metrics such as infection rates, recoveries, deaths, and vaccination progress. By importing data from reliable sources, users can build interactive dashboards that provide real-time updates on global, national, or regional trends. Utilizing the powerful visualization capabilities of Tableau or Power BI, the dashboard can display heat maps, line graphs, and bar charts to help users analyze patterns and correlations, such as the impact of interventions or the spread of variants. These dashboards enable healthcare organizations, governments, and the public to make informed decisions based on the latest data insights.

Netflix Dashboard (Tableau / PowerBI)
Working on a Netflix dashboard using Tableau or Power BI involves visualizing user and content data to track important metrics such as viewership trends, user engagement, popular genres, and content performance. By importing Netflix data, analysts can build interactive dashboards that display key insights using graphs, heatmaps, and trend lines. These visualizations can help identify top-performing shows, regional preferences, and seasonal spikes in viewer activity. Additionally, advanced features like segmentation can provide a breakdown of user demographics and subscription behavior. This dashboard enables Netflix to optimize content recommendations, improve user experience, and make data-driven decisions for content strategy and marketing efforts.

Airline Data Analysis (Sentiment analysis Data mining ) – Python
Airline data analysis using Python, incorporating sentiment analysis and data mining, involves extracting insights from customer feedback and operational data. Sentiment analysis, using libraries like **NLTK** or **TextBlob**, helps in understanding customer emotions, identifying trends in positive, neutral, or negative feedback from sources such as social media, reviews, or surveys. Meanwhile, data mining techniques like clustering, classification, and regression can be applied to operational data to uncover patterns related to flight delays, cancellations, and customer preferences. Together, these analyses provide airlines with actionable insights to improve customer satisfaction, optimize operations, and tailor marketing strategies based on passenger behavior and sentiment.
Our Hiring Partners


Meet Our Mentors

Vedansh Sahu
Data Analytics Trainer
5+ years of experience

Rohitha Reddy
Data Science Career Counsellor
8+ years of experience

Srikanth Burgula
Sr Career Counsellor
13 years of experience
Month On Month Journey
Step-by-Step Mastery: From Basics To Internship
Introduction to Digital marketing, Website Designing (WordPress), Search Engine Optimisation, Social Media Marketing (Facebook, Instagram, LinkedIn, Youtube)
Month 1
Google Ads, Email Marketing, Account Based Marketing (LinkedIn Navigator), Projects Execution, Resume Preparation, Internships
Month 2
Our Learners Feedback
Trustindex verifies that the original source of the review is Google. I'm still pursuing my Digital Marketing course at WhiteScholars, and honestly it's been a game-changer so far! Every session is filled with practical learning I'm already working on real-time ad campaigns, SEO projects, and content strategy The mentors are incredibly supportive and explain concepts in a very easy-to-understand wayTrustindex verifies that the original source of the review is Google. I enjoyed learning digital marketing course training in Hyderabad.I completed email marketing,Seo, Google Ads and ABM ,still going on the program .Untill Now I completed case studies and real- time projects with the help industry experts . While doing my course I already got placed at a company to handle social media marketingTrustindex verifies that the original source of the review is Google. I’m currently pursuing the Data Analytics course in Hyderabad, and attending sessions at whitescholars , Kukatpally center. So far, it’s been a very positive and exciting experience. In the beginning, I found it a bit challenging to cope with the assignments. Some concepts felt tough when I tried to apply them on my own. The trainers are really supportive. They take the time to explain things clearly and provide extra help whenever needed. That made a huge difference for me. What I’m really enjoying about this course is the hands-on practice and real-time projects. We're not just learning theory. We’re actually working on real-world scenarios that help us understand how data analytics works in actual jobs. If you really want to become a data analyst, you will have to give your complete three months to completing projects and assignments.Trustindex verifies that the original source of the review is Google. I learned a lot new things related digital marketing and industry oriented curriculum ,enjoyed learning this course. What really stood out was their digital training with real-time projects. I worked on live campaigns, learned tools like ABM,SEO, and Meta Ads, and got hands-on experience that built my confidence. The best part? Their placement team guided me through mock interviews and resume building.Trustindex verifies that the original source of the review is Google. I choose data analytics as it's one of the trending fields and upcoming one , there are many data analytics jobs in the market so I want to upskill my self and get a good job into IT sector . This is one of the best data analytics course for beginners in Hyderabad. The mentors are very good and supportive. I have completed one month of my course and will soon start with the real world projects. Thank you whitescholarsTrustindex verifies that the original source of the review is Google. After B.Tech, I was unsure about my career path until I joined White Scholars. Their Data Science course gave me the clarity, skills, and confidence I needed. The course is well structured and gives hands on experience to us with the live projects that we do here. This course is best designed as data science beginners course. I highly recommend data science course in Hyderabad for those who are looking to join IT sectorTrustindex verifies that the original source of the review is Google. I’ve been learning Data Analytics at White Scholars for the past month, and I must say, it’s one of the best data analytics courses for beginners. As someone who enjoys working with large datasets and has always been curious about data manipulation, this course is exactly what I was looking for. The mentors are highly supportive and knowledgeable, making complex topics easy to understand. We’ve covered many essential concepts already, and the weekly assignments are a great way to stay consistent and reinforce learning. If you're looking to build a strong foundation in data analytics, Excel, SQL, Python, or tools like Power BI, I highly recommend White Scholars. The course structure is beginner-friendly yet thorough perfect for anyone serious about starting a career in data.Trustindex verifies that the original source of the review is Google. I enrolled in the Data Analytics course at White Scholars, and my experience has been genuinely positive. The institute provides a well-structured curriculum that balances both theoretical concepts and practical application. The Data science as trainers are knowledgeable, approachable, and always ready to support students through their learning journey.Verified by TrustindexTrustindex verified badge is the Universal Symbol of Trust. Only the greatest companies can get the verified badge who has a review score above 4.5, based on customer reviews over the past 12 months. Read more
People Also Search For
-
data analytics course in hyderabad
-
how to learn data analytics
-
best data analytics training
-
best data analytics certification course
-
data analytics course with placement
-
data analytics course for beginners
-
best institute to learn data analytics
-
best data analytics institute in hyderabad
-
data analytics course training in hyderabad
-
online data analytics course
-
data analytics course in hyderabad for freshers
-
data analytics institute near me
-
data analytics course duration
-
data analytics course fee
We've got answers
Frequently asked questions
Quick answers to questions you may have. Make an informed decision before embarking on your learning journey.
Data analytics is the process of analyzing data to find patterns, trends, and correlations. It involves collecting, cleaning, and interpreting data to generate insights that can be used to solve problems and make decisions.
To learn a Data Analytics course, start by enrolling in a reputable program that covers essential topics like data cleaning, visualization, statistical analysis, and tools such as Excel, SQL, Python, or Tableau. Practice with real-world datasets through hands-on projects and case studies to build practical skills. Utilize online resources, tutorials to deepen your understanding and stay updated with industry trends.
Data Analytics can be learned by anyone interested in interpreting data to make informed decisions. It is ideal for students, professionals, or individuals from various fields like business, engineering, finance, or marketing. No prior technical experience is necessary, as many courses start with the basics, but a logical mindset and familiarity with Excel or basic statistics can be advantageous.
The prerequisites for a Data Analytics course typically include a basic understanding of mathematics, statistics, and logical reasoning. Familiarity with Excel and basic programming concepts is beneficial but not mandatory, as many beginner-friendly courses cover these fundamentals. A curious mindset and willingness to learn are the most important requirements.
The duration of a Data Analytics course can vary depending on the intensity and curriculum. Typically, it's a 6 months course.
The fee for a Data Analytics course in Hyderabad can vary depending on the institute and the specific program. Please contact us for detailed pricing information.
Upon successful completion of the course, you will receive a recognized certification in Data Analytics.
Data Analytics course typically covers essential topics to equip learners with the necessary skills for data-driven decision-making. These include data collection and cleaning techniques to prepare datasets for analysis, followed by data visualization using tools like Tableau, Power BI, or Excel to create meaningful insights. Learners also explore SQL and database management for querying and organizing data, along with programming basics in Python or R for data manipulation and analysis. Advanced analytics topics, such as predictive modeling, machine learning basics, and A/B testing, are often included.
Yes, the course includes practical exercises, lab sessions, and real-world projects to enhance your learning.
Our instructors are highly experienced Data Analytics professionals with extensive industry knowledge.
We maintain a low student-to-instructor ratio to ensure personalized attention and support.
Yes, we provide regular doubt-clearing sessions and online forums for students to interact with instructors and peers.
Whitescholars Academy is one of the leading institutes offering top-notch data analytics course in Hyderabad.
Yes, Whitescholars Academy has a center in Kukatpally, making it convenient for learners in the area to attend data analytics course.
To learn data analytics effectively, you need a combination of theoretical knowledge and practical experience. Consistent practice, working on real-world projects, and staying updated with the latest trends are crucial.
Yes, after a student completes the Data Analytics course and clear the mock interview we provide them 100% job placement opportunities and make them job ready to attend the interviews.

© Copyright – WhiteScholars Academy 2024