

Learn Data Analytics Even If You Are From a Non-Technical Background
Learn data analytics from non technical background by understanding fundamentals, working on real projects, and developing job-ready analytical skills step by step.
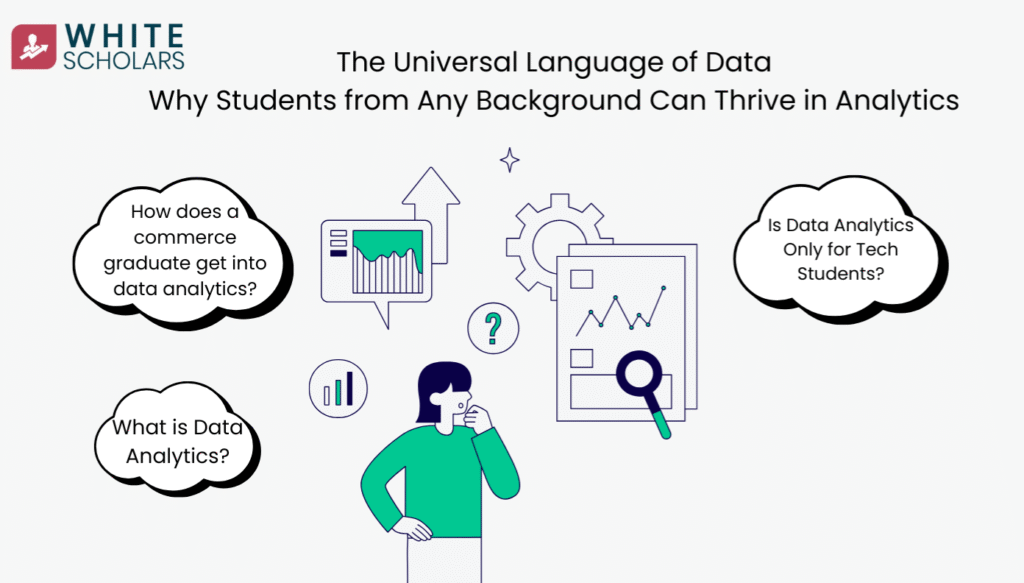
What is Data Analytics?
Data analytics is the science of analyzing raw data sets to extract meaningful insights that can help businesses make better decisions. It is frequently referred to as a “gateway” into the larger fields of data science and artificial intelligence.
At its core, the role entails understanding how a business operates by focusing on three key performance indicators (KPIs): revenue, cost, and profit/loss. By identifying sub-KPIs within these categories, analysts provide the strategic insights required to gain a competitive advantage.
Is Data Analytics Only for Tech Students?
No, data analytics is not just for people with technical degrees; anyone, regardless of educational background, can succeed in this field. While students with a background in computer science, mathematics, or statistics have an advantage, the profession is increasingly attracting people from the social sciences, natural sciences, business, and even the humanities.
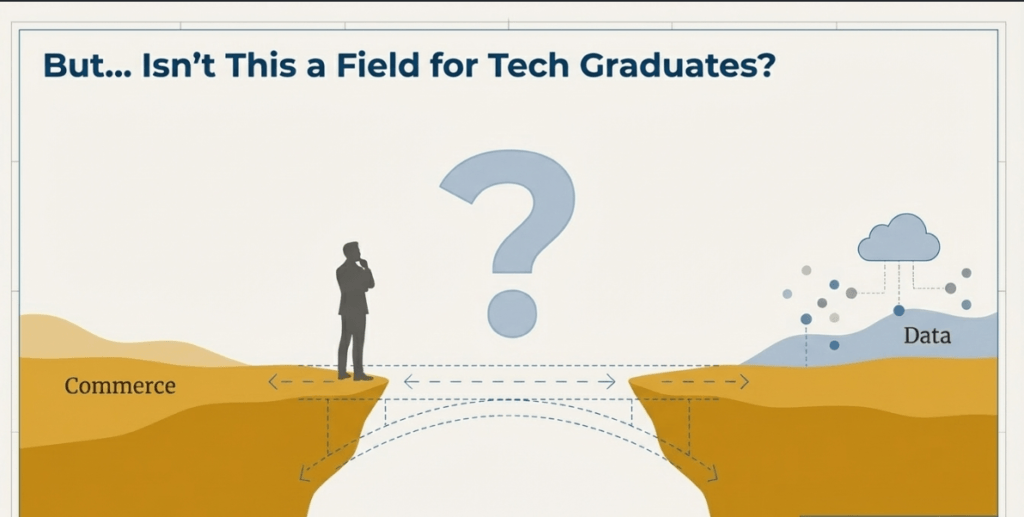
A commerce graduate, for example, can apply their prior knowledge of business and economics to pursue data-driven careers. Even those with an arts background can pursue this path, as long as they are willing to put in the extra effort to bridge the technological gap.
Why is it for everyone?
Data analytics is accessible to all because success requires a combination of technical knowledge, analytical thinking, and curiosity. Several factors make it inclusive:
- Transferable Skills: Non-technical students frequently bring valuable skills such as critical thinking, creativity, and effective communication to the industry.
- Mindset over Experience: Industry leaders frequently prefer hiring “curious” individuals who are eager to learn and step outside of their comfort zone over those with technical experience but a negative attitude.
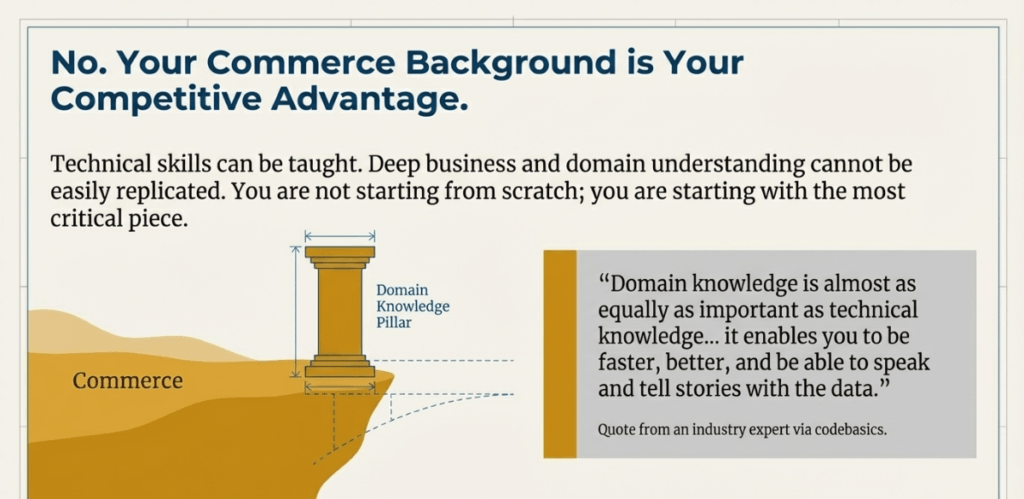
- Domain Knowledge: Expertise in a specific industry (e.g., healthcare, finance, or retail) is regarded as nearly as important as technical knowledge. An analyst with domain knowledge can ask better questions and tell a more compelling “story” using data that business stakeholders can use.
- Self-Study Accessibility: Many professionals now enter the field through online courses, tutorials, and hands-on projects, demonstrating that a formal technical degree is not the only option.
Skills Required for Data Analytics
To become a skilled data analyst, one must master a number of technical and core competencies:
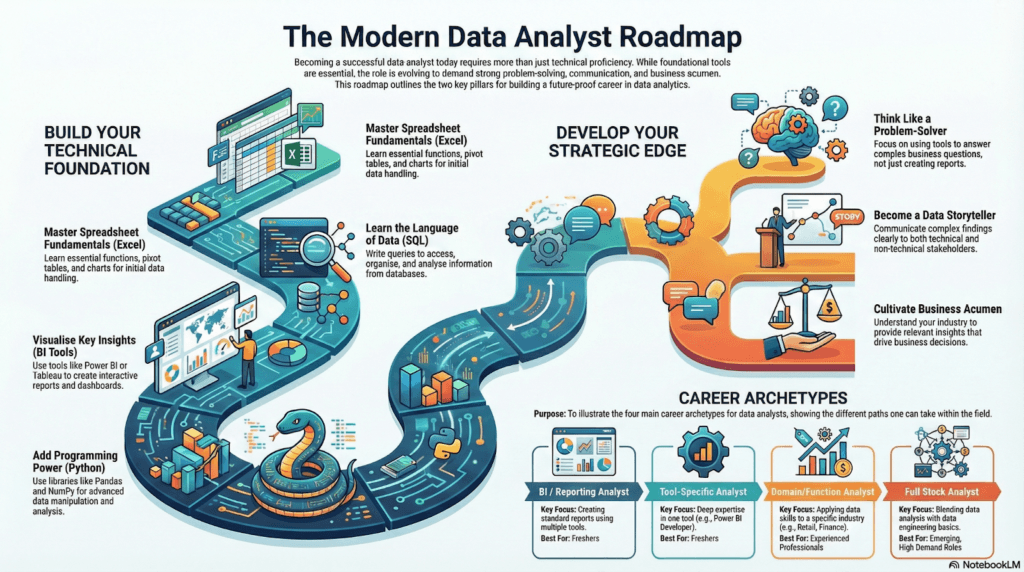
From the above roadmap, the skills required are
Technological foundations:
- Mathematics and statistics: Understanding concepts such as mean, median, standard deviation, probability, and hypothesis testing is critical when evaluating data models.
- Excel: Understanding functions, pivot tables, and charts is essential.
- SQL (Structured Query Language) is required for managing and querying databases in order to access and organise information.
- Programming: To manipulate and analyze data, you must know Python or R.
- Data Visualization: Using tools like Tableau or Power BI, as well as libraries like Matplotlib or Seaborn, to clearly communicate findings via dashboards.
- Data Engineering Fundamentals: Understanding how data flows from sources to tables (ETL processes) is becoming increasingly important for “full-stack” positions.
Core and Soft Skills:
- Communication and Storytelling: The ability to explain complex findings to non-technical stakeholders in straightforward, business-oriented language.
- Problem-solving involves breaking down business challenges into manageable, data-driven tasks.
- AI Awareness: Understanding how to use generative AI tools (e.g., ChatGPT or Claude) to increase productivity and automate manual reporting.
- Stakeholder management is the process of managing managers’ and executives’ expectations through consistent and clear collaboration.
Why It Is in Demand These Days
Data analytics is in high demand because businesses are increasingly relying on data-driven decision-making to stay competitive. As businesses collect massive amounts of data, they require analysts to interpret it across a variety of industries, including marketing, finance, healthcare, and manufacturing.
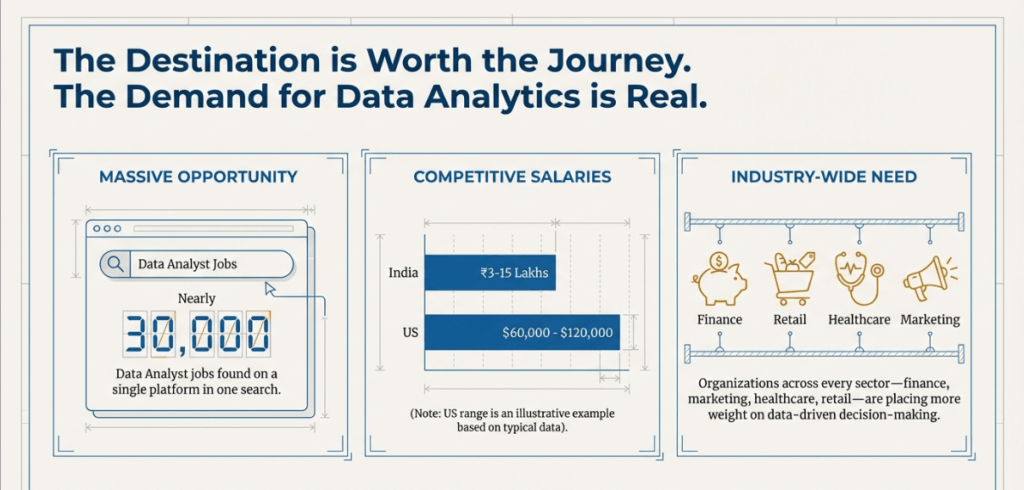
Furthermore, as AI replaces manual reporting tasks, there is an increasing demand for human analysts who can provide strategic collaboration and critical thinking that machines cannot replicate.
How does a commerce graduate get into data analytics?
As a commerce graduate, you are uniquely positioned to transition into data analytics because you already have a solid foundation in business operations and economics.
While you must learn technical skills, your ability to apply business logic to data-driven decision-making gives you a significant advantage in the job market.
The following steps outline how to make this transition:
1. Utilize Your Business and Domain Knowledge.
Your commerce background gives you business acumen, which is often just as important as technical knowledge.
- Focus on KPIs: Recognize that most business analysis is based on three primary metrics: revenue, cost, and profit or loss.
- Domain Specialization: If you are knowledgeable about specific functions such as finance, marketing, or retail, you have a “massive advantage” because you can ask relevant questions that a purely technical analyst might miss.
- Function-Specific Roles: Look for “Domain/Function Specific Analyst” positions, such as Finance Analyst or Marketing Analyst, where your commerce degree is most useful.
2. Build a Technical Foundation
Because commerce degrees may not place a high value on technical skills, structured learning is required to close the gap.
- Mathematics and Statistics: Understand the fundamentals, such as mean, median, standard deviation, probability, and hypothesis testing. This facilitates the development and evaluation of data models.
- Excel Mastery: Spend two to three weeks mastering functions, pivot tables, and charts, as many businesses continue to rely heavily on Excel for preliminary analysis.
- SQL (Structured Query Language): This is required to manage and query databases. It is one of the most sought-after skills across all data roles.
- Programming (Python or R): Learn a flexible language like Python, with an emphasis on data manipulation libraries like Pandas and NumPy.
3. Learn Data Visualization and Communication.
An analyst’s job is more than just crunching numbers; it is to tell a story that influences business decisions.
- BI Tools: Discover how to build interactive dashboards with tools like Power BI and Tableau. Power BI is frequently recommended for beginners due to its seamless integration with other Microsoft products.
- Communication Skills: You must be able to “switch gears,” explaining technical findings in simple business terms to stakeholders who are not necessarily tech-savvy.
4. Create “Proof of Work.”
For a non-technical graduate, demonstrating your abilities through practical projects is essential.
- Business-Centric Projects: Carry out projects using real-world datasets to solve specific business problems, such as a revenue insights project or a retail analysis.
- Create a portfolio website or use platforms such as Linktree to store your code, dashboards, and video presentations.
- ATS Resume: Create a resume that is optimized for Applicant Tracking Systems (ATS) by including relevant keywords and highlighting your domain expertise.
5. Networking and Mindset.
Success in this transition necessitates a shift in both your professional network and perspective.
- LinkedIn Strategy: Use LinkedIn as a marketplace by actively engaging with the data community and asking insightful questions rather than making generic comments.
- Join Communities: Joining groups like the Indian Data Club can help you find “learning buddies” and stay accountable.
- The “Hero Mindset”: Recognize that the field is competitive and requires discipline; avoid a “victim mindset,” and commit to at least 4 hours of study per day for 4 to 6 months.
Strategic Career Pathing
Navigating the Four Tiers of Data Analyst Roles is a great, in-depth topic that will help you learn more about the role.
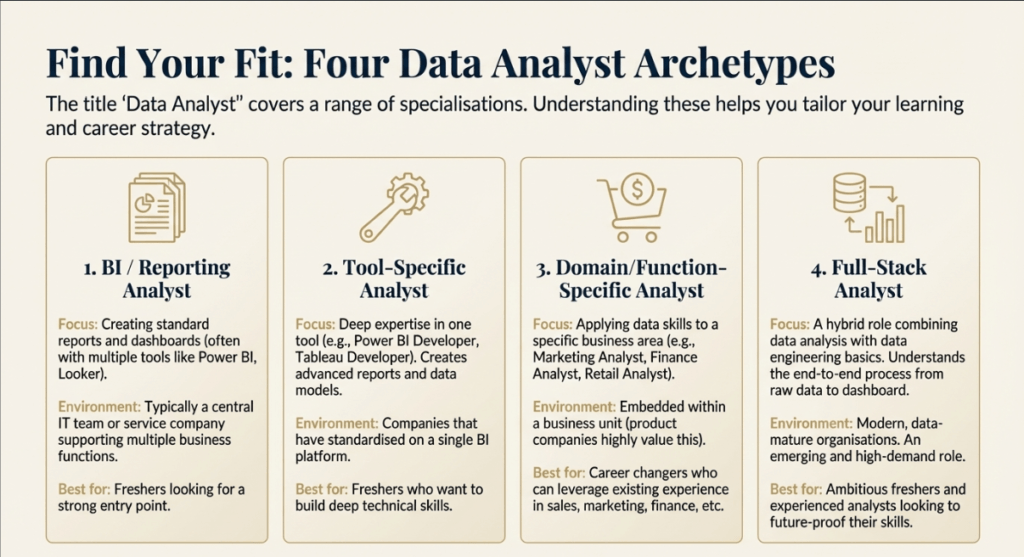
As you enter the field, you must understand that “data analyst” does not refer to a single job description; rather, the industry is divided into several distinct categories. These roles vary greatly in terms of technical depth, business focus, and “fresher-friendliness.”
1. BI Reporting Analyst (The Entry Point)
This position is commonly known as a reporting analyst or MIS (Management Information Systems) executive.
- Focus: Your primary responsibility is to collect information and convert it into standard reports that adhere to existing formats.
- Tools: You will most likely use multiple Business Intelligence (BI) tools (such as Power BI, Tableau, or Looker Studio) because these roles frequently support multiple departments within a central IT team or multiple clients in a service company.
- Accessibility: This is regarded as the most beginner-friendly role because it entails basic to mid-level reporting rather than developing complex new systems.
2. Tool-Specific Analyst (The Specialist).
This category includes job titles that are directly related to a specific technology, such as Power BI Developer or Tableau Developer.
- Rather than using multiple tools superficially, you focus on one platform to create advanced dashboards, semantic data models, and stored procedures.
- Suitability: This is another category that is well-suited to beginners. If you master one tool and create a strong portfolio of “proof of work,” you can land these roles even if you have no prior experience.
3. Domain/Function-Specific Analyst (The Subject Matter Expert)
These roles are named after the industry or business function they serve, such as retail analyst, marketing analyst, or finance analyst.
- Focus: This requires a thorough understanding of domain knowledge, as well as familiarity with the specific “language” of an industry (e.g., healthcare or banking) and its key performance indicators (KPIs), such as customer acquisition costs and lifetime value.
- The Advantage for Career Changers: This tier is ideal for students with non-tech backgrounds. If you have a background in commerce or the arts, you can use your existing sector knowledge to gain a “massive advantage” that purely technical candidates frequently lack.
4. Full-Stack Analyst (Emerging Standard)
This is a rapidly emerging role in which data analytics and data engineering are merging.
- Focus: A full-stack analyst does more than just analyze data in a table; they understand how it got there in the first place. This requires knowledge of cloud platforms (Azure, AWS, or Snowflake) as well as basic ETL (Extract, Transform, Load) processes.
- Requirement: While it may appear intimidating, freshers are encouraged to strive for this because even a basic understanding of data engineering fundamentals significantly increases your marketability.
Which Role Should You Choose?
If you have a non-technical background, follow this two-pronged strategy:
- Begin as a Domain Specialist: Apply your previous education (e.g., finance or social sciences) to solve specific business problems.
- Adopt a “Hero Mindset”: Treat yourself as a product, constantly adding “features” (new skills) so that the market cannot resist you.
Bridging the Gap: Why WhiteScholars is the Premier Choice for Commerce Students
Structured training is essential for commerce students because it fills the gap between business logic and technical execution. While commerce provides a solid foundation in economic theory, data science explains the mechanics of modern systems such as Instagram and YouTube content recommendations.
WhiteScholars EdTech provides the necessary structure to transform these students into “job-ready” professionals through a mission that focuses on personalized and effective training.
Key Highlights of White Scholars Training:
- Expert Mentorship: Learn from senior data analysts (8+ years of experience) and data scientists (10+ years of experience) at top companies.
- Industry-standard tools include SQL, Python, Power BI, and Tableau, which were learned intensively over 180 hours.
- Portfolio Development: Students complete 7+ real-time projects and 8 domain-specific projects to ensure their skills are relevant and immediately applicable.
- Global Validation: Certification is offered in collaboration with Microsoft and NASSCOM.
- Career Guarantees: Graduates receive guaranteed interviews and virtual internships with Accenture and PwC.
WhiteScholars specializes in customized solutions that help individuals overcome obstacles and achieve real-world success in an ever-changing technological landscape.
Final Thought
While entering the field from a non-tech background is entirely possible, it necessitates discipline and a dedication to continuous learning. The job market is competitive, and success frequently goes to those who treat themselves as a “product,” constantly developing new “features” or skills to ensure they are the best fit for the market.
Students of all backgrounds can learn data analytics by mastering SQL, Python, and statistics. Leveraging unique domain expertise and strong soft skills provides a significant competitive advantage in this sector.
Frequently Asked Questions
1. Can someone with a non-technical background become a data professional?
Yes, people from fields such as humanities, business, and social sciences can successfully transition to online courses, bootcamps, and self-study. Success in this field is dependent on a curious, analytical mindset and a commitment to learning technical skills such as programming and statistics.
2. Do I need a high-level mathematics degree to advance in this field?
While a specialized degree is not required, basic knowledge of statistics, probability, and linear algebra is essential for success. These concepts serve as the foundation for developing and evaluating data models, as well as understanding data principles.
3. What are the career opportunities for non-technical students in data science?
The prospects are very promising, as organisations in a variety of industries, including marketing, healthcare, and finance, increasingly rely on data-driven decision-making. Non-technical students can gain a competitive advantage by combining their technical skills with their specific subject matter expertise and domain knowledge.
4. Which tool should I learn first, Power BI or Tableau?
If you are a beginner, Power BI is frequently recommended because it is the market leader and integrates seamlessly with other popular Microsoft tools. However, the fundamentals are similar across both platforms, so once you master one, you can easily transfer your skills to the other.
5. How does WhiteScholars help its students make the transition from theoretical learning to professional employment in the data industry?
WhiteScholars facilitates this transition by offering guaranteed virtual internships with prestigious global firms like Accenture and PWC, as well as guaranteed interview opportunities. Students develop a strong professional portfolio by working on up to eight real-time projects across multiple domains under the supervision of experts with over ten years of industry experience. Furthermore, students receive internationally recognized certifications from Microsoft and NASSCOM, ensuring that their abilities are validated by major industry leaders.