

Boost ROI Faster with Powerful Data Analytics Strategies
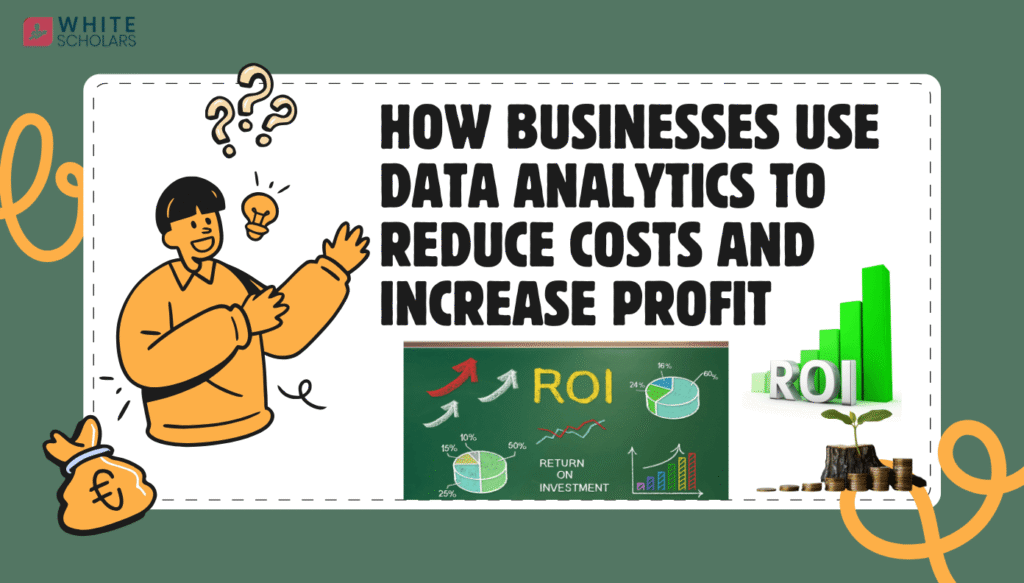
Data analytics for business helps reduce costs, boost ROI, and increase profits through smart strategies and real-world examples.
Introduction
What if business decisions were not made through guesswork but through actual numbers? Today, over 70% of organizations claim that data-driven strategies have helped them boost efficiency and profits. Research reveals that organizations that use data analytics effectively can increase their operating margins by 8-10%.
In simple terms, organizations are cutting costs and boosting profit by leveraging their data.
In this blog, we will discuss how organizations are using data analytics to cut costs, boost ROI, and make better decisions. This guide will also help you understand how data analytics makes a real difference in business; enrolling in the data analytics course in tech hub cities like Hyderabad, Bangalore, and Mumbai may be very helpful in understanding Analytics in depth.
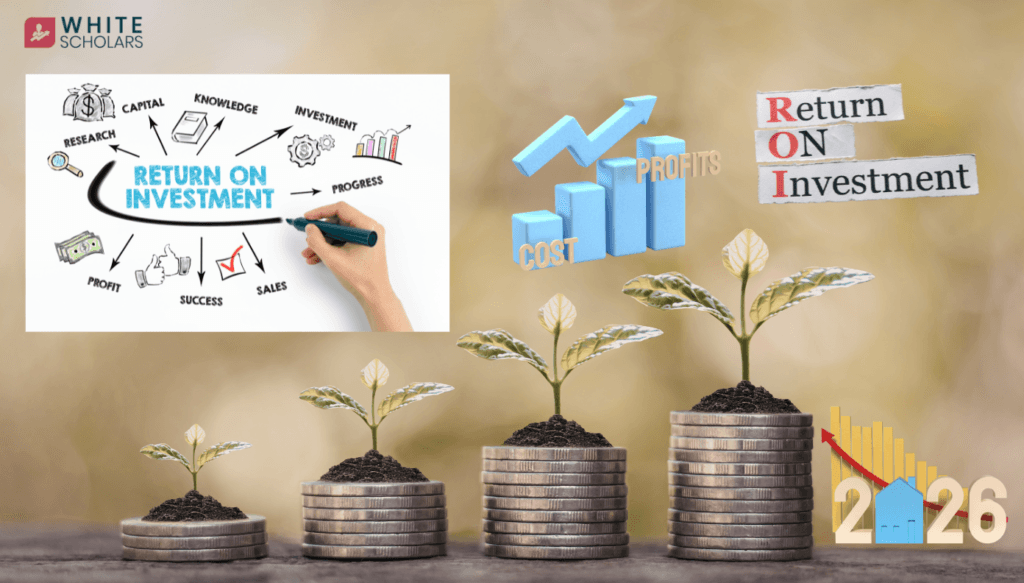
Understanding ROI in Data Analytics
ROI stands for Return on Investment. In the business world, it is used to measure the profit generated compared to the amount of money spent. When data analytics is put into practice, ROI is determined by comparing the cost of data analytics tools, training, and systems with the financial value achieved.
For example, if a retail business applies data analytics to cut unnecessary inventory by 20%, the cost of storage goes down. If marketing campaigns are optimized based on data analysis, the cost of acquiring customers declines. This is because both scenarios directly impact ROI.
Data analytics benefits organizations in the following ways:
- Helps to detect unnecessary spending
- Improves efficiency
- Forecasts future trends
- Enables effective pricing strategies
Measuring ROI from Data Analytics
ROI can be measured through:
- Cost reduction percentage: This is used to calculate the percentage of cost savings that have been realized through analytics. This includes savings in areas such as operations, supply chain, or marketing expenses.
- Increase in revenue: This is used to calculate the revenue growth that has been achieved through analytics. This could be through pricing, campaigns, or customer analytics.
- Customer retention rate: This is used to calculate the percentage of customers retained with the business over time. The higher the retention rate, the lower the customer acquisition costs, and the profits will increase automatically.
- Productivity improvement: This calculates the efficiency of employees or systems in doing the work after analytics-based optimization
- Reduced operational errors: This calculates the reduction in errors, delays, or system downtime due to better monitoring and analysis of data.
When ₹5 lakhs are invested in analytics and ₹12 lakhs are saved or earned, the ROI is easily measurable. This makes analytics a strategic investment rather than an expense.
Tangible Benefits of Data Analytics
Tangible benefits are measurable results. These benefits can be seen directly in numbers.
Businesses use data analytics to:
- Reduce supply chain costs: Optimize delivery routes, suppliers, and transportation data to eliminate unnecessary costs.
- Improve inventory management: Apply demand forecasting and inventory tracking to eliminate inventory shortages or overages.
- Optimize workforce planning: Apply employee performance and workload analysis to optimize task allocation.
- Detect fraud: Apply data analysis and anomaly detection to detect unusual transaction behavior.
- Minimize downtime: Apply predictive maintenance and real-time monitoring to prevent system or equipment failures. this can help in minimizing the downtime.
For Example, manufacturing companies apply predictive maintenance. Equipment is tracked through data. Equipment failures are predicted before they occur. Maintenance and production losses are minimized.
In marketing, campaigns are analyzed based on performance metrics. Poor-performing ads are shut down quickly.
Case Studies: How Businesses Save Costs with Data Analytics
• A logistics firm cut fuel costs by analyzing route optimization.
• An e-commerce business improved profit margins by analyzing consumer buying patterns.
• A healthcare industry minimized appointment no-shows by using predictive analytics.
These examples show that data analytics is not just theory. It generates practical cost savings.
Intangible Benefits of Data Analytics.
Not all benefits are financial. Some benefits improve long-term growth and brand value.
Intangible benefits include:
- Enhanced decision-making
- Increased customer satisfaction
- Faster reaction to market changes
- Improved competitive advantage
When analyzing customer feedback, service quality is improved. When monitoring employee performance data, productivity rises. These benefits indirectly boost profit margins.
Data analytics provides clarity. Rather than addressing problems, businesses address them ahead of time.
Data Analytics Tools and Software
To achieve these benefits, specific tools and skills are required.
Common Tools Used in Data Analytics
- Microsoft Excel is widely used for data cleaning, basic analysis, formulas, pivot tables, and dashboards.
- SQL is used to query, manage, and retrieve data from databases efficiently.
- Python (Pandas, NumPy, Matplotlib): helps in data manipulation, numerical analysis, and visualization.
- R Programming: It is popular for statistical analysis and advanced data modeling.
- Power BI: Power BI and Tableau are visualization tools used to create interactive dashboards and reports.
- Google Analytics: tracks website traffic and user behavior.
- Apache Hadoop handles large-scale data storage.
- Spark processes big data quickly using distributed computing.
These tools help in data cleaning, visualization, statistical modeling, and predictive analysis.
Core skills required include:
- Data cleaning and preprocessing
- Statistical analysis
- Data visualization
- Machine learning basics
- Business understanding
- Communication skills
Students who join organized data analytics training programs get practical experience with these tools. Hyderabad is emerging as a new IT destination, and selecting the appropriate data analytics coaching institute in Hyderabad or Bangalore can offer students exposure to live projects in data analytics.
Future Trends in Data Analytics
The data analytics industry is changing rapidly. As per industry reports, the global analytics market is likely to break the $650 billion mark in the next few years.
Key future trends include:
- Artificial Intelligence integration
- Real-time analytics
- Automated decision systems
- Cloud-based analytics platforms
- Predictive and prescriptive modeling
- Integration of Artificial Intelligence: Artificial Intelligence is integrated into analytics platforms to enable the automatic identification of patterns, anomalies, and insights within large datasets. Machine learning algorithms are used to help businesses to predict, personalize, and optimize processes without human involvement.
- Real-time analytics: Real-time analytics processes the analysis of data as soon as it is created. This allows businesses to react to customer behavior, system notifications, or market changes in real-time, thereby improving agility and decision-making.
- Automated decision platforms: Automated decision platforms enable businesses to make decisions automatically based on predefined rules and machine learning models. They are commonly used in fraud detection, recommendation systems, and credit approval to improve speed and accuracy.
- Cloud-based analytics platforms: Cloud platforms allow businesses to store and analyze large datasets through the internet. They are scalable, flexible, cost-effective, and accessible to businesses of all sizes.
- Predictive and prescriptive modeling: Predictive modeling predicts future outcomes based on past data, while prescriptive modeling recommends the best course of action to attain desired outcomes.
Businesses are transitioning from descriptive analytics (what happened) to predictive analytics (what will happen). This transition unlocks profit opportunities and minimizes risks.
For freshers selecting a data analyst course, it is essential to be aware of these trends since the demand in the industry is rising rapidly
How Freshers Can Prepare for This Career
If you want to build a career in this field, start by learning the fundamentals of data analytics.
Step-by-step approach:
- Learn Excel and SQL basics
- Understand statistics
- Practice Python or R
- Build dashboards using Power BI or Tableau
- Work on real datasets
A practical data analytics course should focus on live projects, business case studies, and interview preparation.
Avoid these mistakes:
- Learning tools without understanding concepts
- Ignoring business applications
- Not building a portfolio
- Skipping data cleaning practice
Consistent practice builds confidence.
Conclusion
Data analytics is changing the way in which businesses function. Expenses are minimized. Margins of profit are increased. Decisions are made with clarity.
ROI can be measurable. Efficiency increases. Competitive advantage is strengthened.
For freshers, this is one of the best areas for career advancement and in-demand jobs. With the right training in data analytics, a bright and fulfilling career can be created.
Start learning today. The future belongs to data-driven professionals.
FAQs
1. In what ways does data analytics help in cutting business expenses?
Data analytics helps in finding areas of inefficiency, wastage, and unnecessary spending. By analyzing data, businesses can optimize processes and minimize wastage. It also helps in avoiding issues in the future.
2. What is the meaning of ROI in data analytics?
ROI is the calculation of the return on investment that has been achieved through data analytics. It compares the cost of implementation with the increase in revenue or cost savings. A higher ROI indicates good use of data analytics.
3. What tools are required for a beginner?
Excel, SQL, Python, and Power BI are some of the most used tools. Knowledge of basic statistics is also required.
4. Is data analytics a good career option in Hyderabad?
Yes. Hyderabad is a growing IT hub, and there is a growing requirement for data analysts. Organizations are hiring qualified data analysts for business intelligence and decision-making roles
5. How long does it take to become job-ready?
Freshers can become job-ready in 4 to 6 months with consistent practice. Practical projects and training help in faster learning.