

Behind the Dashboard: From Data to Decisions
Learn how analysts turn raw numbers into smart business decisions with real examples, tools, skills, and career insights for beginners in data analytics.
Introduction
Did you know that over 90% of the world’s data has been created in the last few years? Every click, purchase, search, and interaction is creating data. However, just having numbers doesn’t help businesses grow. What’s important is how this data is interpreted and turned into decisions.
This is where data analysts come into play. There is so much thinking and problem-solving going on in the background for every dashboard that you get to see. Businesses today are heavily dependent on insights to increase sales, cut costs, and understand customer behavior.
In this blog, you will get to know how data analysts turn data problems into important business decisions, the skills and tools used in this process, real-world examples, and how you can begin your journey with the right data analytics training. If you are a fresher, this guide will help you understand the topic in a much clearer manner.
Messy Data Is Where Real Analysis Begins
The data is never clean. The systems update at different times. The entries are done manually. The formats are different. There are missing values.
Rather than viewing this as a problem, analysts view it as a foundation.
Before creating reports, time is spent in tools such as Power Query asking important questions:
- Which data points are trustworthy?
- What is wrong and needs to be fixed?
- What should be highlighted instead of fixed?
Data cleaning is not about making everything perfect. It is about establishing consistency. When the structure is established, decisions are no longer made out of confusion or noise.
Why this matters:
If the foundation is not stable, then all insights that are built on it become suspect. Strong foundations create trustworthy conclusions
Dashboards Should Inform, Not Impress
A dashboard is not intended to look decorative. Its goal is clarity.
Best practices for Power BI dashboards:
- Highlight key performance indicators clearly
- Point out problems quickly
- Eliminate the need for lengthy explanations
Every component has a reason for being there.
KPIs measure goal achievement. Trend lines show what’s happening over time. Detailed analysis explains why things are happening. Nothing is unnecessary.
Why it matters:
When insights are understood immediately and clearly, decisions are made with confidence.
When Insights Lead to Action
The true value of analytics is not in the dashboard but in what happens later on.
With the right insights, teams can:
- Shift sales focus to better regions
- Change pricing models
- Identify operational inefficiencies early
- Track progress without manually chasing reports
Since dashboards automatically update, conversations change from “What happened?” to “What’s next?”
Why it matters:
Early awareness prevents small issues from becoming big problems.
Understanding the Real Problem Behind the Dashboard

A dashboard can seem very straightforward with the use of charts and graphs, but it holds the answers to key business questions. Even before any report is created, the problem is clearly defined.
For example, consider an e-commerce business that realizes a sudden decline in sales. The problem might seem simple, but it could be caused by several factors. Is there a decline in website traffic? Are customers abandoning their carts? Has the performance of advertisements declined?
An analyst starts by asking the right questions. Data is extracted from various sources such as CRM systems, websites, and advertising tools. The data is then cleaned and prepared before analysis. Patterns are identified only after careful analysis.
In most organizations in Hyderabad, this is done by trained professionals who have a deep understanding of business and data analytics terms.
Step-by-Step Approach Used by Analysts
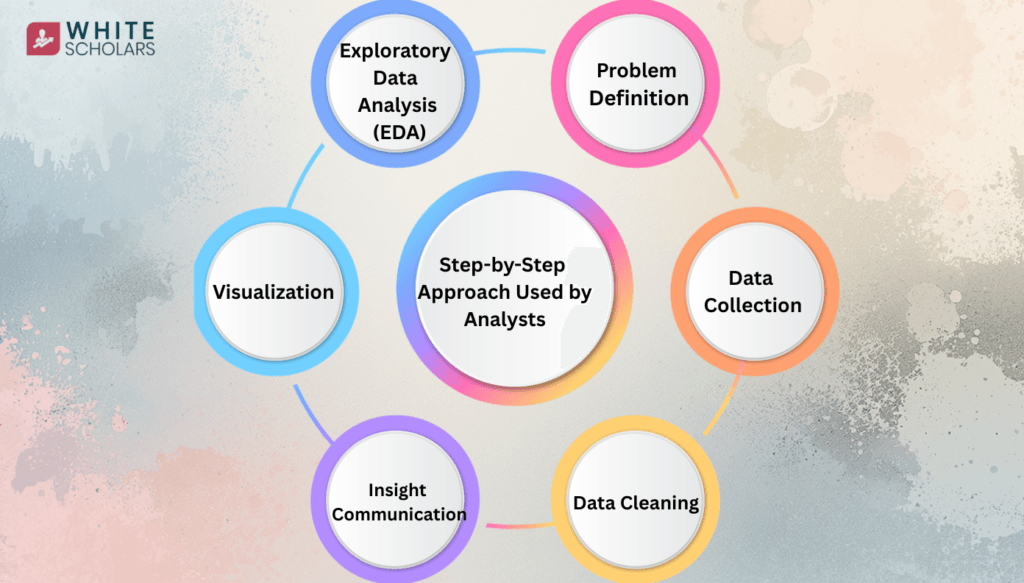
- Problem Definition – Understanding what the business wants to solve.
- Data Collection – collecting data from databases, Excel sheets, APIs, or cloud services.
- Data Cleaning – Removing duplicates, correcting errors, and handling missing values.
- Exploratory Data Analysis (EDA) – Identifying patterns and trends.
- Visualization – Creating dashboards with tools.
- Insight Communication – Sharing findings with key stakeholders.
For example, if sales are dropping, analysis may explain that mobile users are facing checkout issues. Once identified, the company can fix the issue and recover revenue.
From Numbers to Insights: Skills That Make It Possible
Behind every good analysis, it requires certain technical skills to be applied. A person in this field needs to have a good background in the following:
- Statistics and Probability
- SQL for database querying
- Python or R for data manipulation
- Excel for reporting
- Data Visualization tools
- Critical thinking and problem-solving
- Business understanding
A comparison will help. Data is like raw material. Technical skills are like cooking methods. Without proper methods, the end result will be useless.
For example, correlation analysis may reveal that customers who buy twice a month are 40% more likely to subscribe to premium services. This information can be used by the marketing department to target the right people.
Hence, analysts should have logical thinking along with technical skills; therefore, students joining a data analyst course in Hyderabad are taught not only technical skills but also how to apply logical thinking to business problems.
Tools Commonly Used in Data Analytics
There are various tools used in the industry:
- Microsoft Excel for simple data review and summaries
- SQL – For extracting structured data from databases
- Python with Pandas NumPy and Matplotlib used for analyzing data
- power bi and tableau for dashboards
- Google Analytics tracks website activity
- Jupyter Notebook for Analysis Documentation
Fresh skills come from organized courses in data analytics institutions, using real tasks to get hands-on experience. Projects during lessons help learners see how things work in actual situations.
DAX: Where Numbers Turn Into Meaning

DAX: Where Numbers Become Meaningful
Once the data is ready, attention moves towards interpretation. The answer is no longer “What is the total?”
The answer is, “What does this total mean?”
This is where DAX is extremely effective. Rather than displaying basic totals, it helps to answer deeper business questions:
- Is progress improving or slowing down?
- Which products are truly profitable?
- Is growth driven by demand or deep discounts?
- Where are hidden losses happening?
DAX formulas allow calculations to dynamically adjust to time, filters, and business context.
Why this is important:
Executives do not make decisions based on isolated numbers. They make decisions based on comparisons, patterns, and trends.
Real-Life Example: Turning Data into a Business Strategy
Let us consider the case of a retail company that wants to maximize profits. The sales data shows that the company is making the same amount of sales, but the profits are going down.
After analyzing the data, the analysts may conclude that the company is giving massive discounts on products that already have low margins. The recommendation would be to change the pricing structures for certain groups of products.
In this manner, the profits can be maximized without necessarily increasing the sales. This is how decisions are made after conducting thorough analysis.
In Hyderabad, there are many startups and IT companies that require professionals who have been trained in a good data analytics course. This is because there is a massive demand for trained professionals due to the fact that data-driven decision-making improves business performance by nearly 20–30% in many industries.
The Analyst’s True Role: A Translator of Data
An analyst is not just a person who works with numbers on a computer screen. There is much more to this job. They act like a bridge between the raw data and the real business decisions.
Most business leaders do not think in terms of formulas, tables, or code. They think in terms of goals, revenue, growth, costs, and performance. On the other hand, data comes in the form of spreadsheets, databases, dashboards, and technical metrics. The analyst is in the middle and connects these two worlds.
When a manager asks, “Why are our sales dropping?” they are not asking for a chart. They are asking for clarity. The analyst looks at the data, finds patterns, compares periods, and then answers the question in simple terms. Instead of saying, “The month-over-month variance is negative,” a good analyst might say, “Sales dropped mainly because repeat customers purchased less this month.”
That is translation.
An analyst translates:
- Raw numbers into clear insights
- Business questions into measurable metrics
- Complex calculations into simple explanations
- Patterns into practical actions
It is not enough to be familiar with tools such as Power BI, Excel, SQL, or DAX. These are technical skills. What matters most is the ability to understand the business context. Analysts need to ask the following questions:
- “What decision will this information impact?”
- “Who will use this report?”
- “What should be done after seeing this number?”
The greatest analysts are problem solvers. They do not only report information; they also tell a story. They point to what is important, eliminate unnecessary noise, and point the decision-makers to the next step.
In simple terms, the role of an analyst is not to impress people with numbers. It is to help people understand what the numbers mean and what should be done about it.
Common Mistakes Beginners Should Avoid
- Lack of understanding of concepts and focusing only on tools
- Ignoring the data cleaning process
- Misinterpreting the concept of data visualization
- Drawing conclusions without statistical validations
- Overloading dashboards with unnecessary charts
Strong fundamentals are built when a structured data analytics course is taken seriously with practice-based learning.
Why Choosing the Right Learning Path Matters
For freshers, proper guidance is very important. It is not enough to watch random tutorials on the internet. There is a need for a proper learning path in which projects, assignments, and real-world data are provided.
A proper data analytics course in cities like Hyderabad, Bangalore, Chennai, etc., provides hands-on experience along with industry-standard tools. When proper learning is provided by experienced professionals, confidence is greatly boosted.
Most schools in Hyderabad let learners do actual tasks like studying sales numbers, grouping customers, checking performance, and predicting trends. Doing so helps them get ready for jobs that demand these skills.
Bonus Tips for Career Growth
- Create a portfolio of 3-5 projects
- Spend time each day practicing SQL queries
- Engage in Kaggle competitions
- Learn the basics of machine learning
- Work on improving communication skills to effectively communicate insights
It is always important to remember that data analytics is not coding. It is the effective solution to real-world business problems.
Conclusion
Data dashboards may look simple, but the power of analytical thinking is at work in the background. Right from the point of discovering business issues to providing strategic solutions, every process is guided by organized processes and tools.
For freshers who want to pursue a career in this area, it is important to develop a strong foundation by learning and by doing consistent practice.
The journey begins with learning, but growth is achieved by implementation.
FAQ’s
1. What does a data analyst actually do?
A data analyst works with data to provide better insights to businesses. They create reports and data dashboards to present results. These insights are then presented to business managers to help them perform better.
2. Is data analytics a good career for freshers?
Yes, it is one of the fastest-growing career paths. Many organizations are now focusing on data analytics. With the right skills and experience, it is possible to get a job.
3. What skills are required to start a career in data analytics?
Basic knowledge of statistics, SQL, Excel, and Python is required. Data visualization tools like Power BI or Tableau are also used.
4. How long does it take to learn data analytics?
Basic knowledge can be gained in 4 to 6 months with dedication. But advanced topics may take more time to learn, depending on the practice level.
5. What is the best way to learn data analytics in Hyderabad?
Learning through a course with projects is the best way to learn data analytics. Choosing a good data analytics coaching center with a focus on implementation will help to gain practical knowledge in the industry.