

5 Data Analytics Projects To Impress Your Next Employer

Explore 4 data analytics projects that help freshers build a strong portfolio. Learn practical skills through data analytics training and stand out to employers.
Introduction
It may seem challenging at the beginning. Many freshers, students, job seekers, and career changers may ask the same question:
“How do I prove to the employer that I possess real data analytics skills?”
Here is an interesting fact. According to industry reports, more than 70% of hiring managers prefer candidates with projects, even if they are fresh graduates.
So, if you are a self-learner, boot camp student, SQL learner, Excel analyst, or Power BI learner, you should focus on creating the right projects. A good portfolio will help recruiters understand that you can work with real-world data, analyze the information, and present the insights.
In this blog, you will learn how to create a good impression on your employers with top five real-world data analytics projects. You will also learn about the tools used in the field.
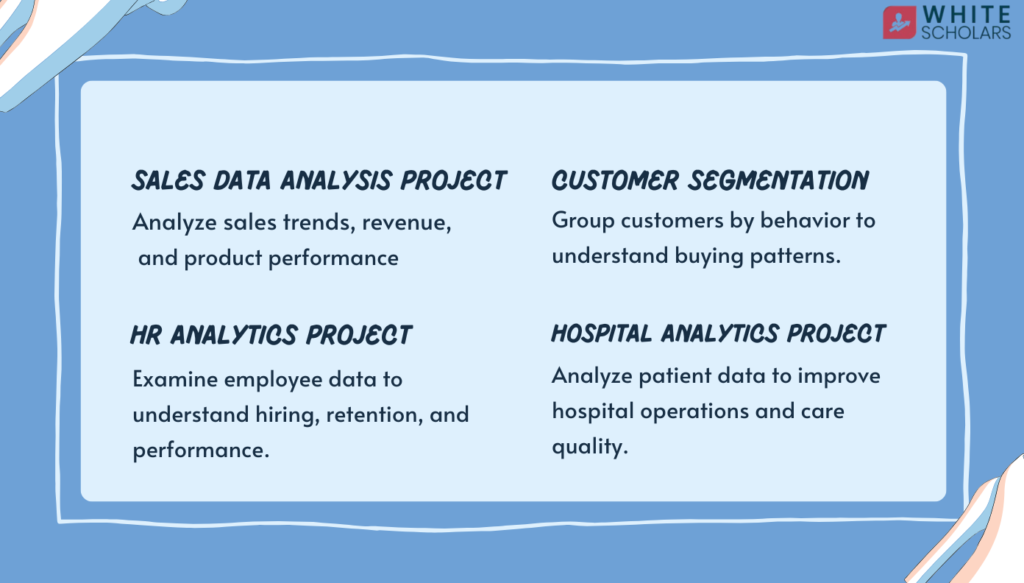
Sales Data Analysis Project
One of the most common projects that a beginner can work on includes sales data analysis. Every business generates huge sales data, and a company needs people with expertise to analyze this data.
In this project, the sales data will be analyzed to identify trends such as customer behavior, product performance, and seasonal trends.
For example, an entry-level analyst or a DA beginner can work on analyzing the sales data for an online store to identify answers to questions such as:
- Which products are generating the most revenue?
- In which months are the sales high?
- Which region is generating the most revenue?
These questions will help a business make informed decisions on marketing and inventory.
Tools and Skills Used in This Project
For this kind of project to be completed, there are a number of data analytics tools that can be used.
These tools are:
- Microsoft Excel for data cleaning and analysis
- SQL for querying data
- Power BI or Tableau for visualization
- Python (optional) for in-depth analysis
Students pursuing a data analytics course in Hyderabad or bangalore often get to solve such a project to get an idea of how business data is analyzed in real-life situations.
For Excel users or those familiar with Tableau, this project is a great place to begin.
Customer Segmentation Analysis
Another valuable project is customer segmentation, which employers also appreciate. A business needs to understand its customers in order to develop an effective marketing strategy.
For this project, the customers are segmented based on various factors such as:
- Purchase frequency
- Spending habits
- Product preferencesGeographical location
By analyzing the customers in this way, businesses can easily identify the most valuable customers.
For instance, a retail store may realize that a certain group of customers frequently purchases high-end products. The marketing strategy may then target the promotion of such products to the identified group of customers.
Methods and Tools Used
Typically, customer segmentation projects will involve these tools and techniques:
- SQL for querying customer data
- Excel or Python for data preprocessing
- Power BI or Tableau for creating a visualization dashboard
- Clustering techniques for customer clustering
For a data analyst course in tech hub cities like hyderabad, many learners work on customer segmentation projects because it shows problem-solving ability.
For a portfolio builder and a datascience graduate, this project shows the ability to derive insights from customer data.
Financial Performance Dashboard
Another great project for beginners to undertake includes the building of a financial dashboard. This is because businesses depend significantly on financial data to gauge their success and plan their future business strategies.
In the project, financial data, for instance, revenue, expenses, and profits, is analyzed and represented using interactive dashboards.
The objective of the project is to ensure financial data is easily understandable by managers and other key decision-makers.
- Trends of revenue generated by the business over the months
- Profit margins
- Breakdown of expenses by departments
- Comparative analysis of regions
The project would be very useful to PowerBI learners and Tableau users since these tools are commonly used by companies for reporting purposes.
Visualization Tools for Dashboard Projects
Interactive dashboards for the project may be developed using the following tools:
- Power BI
- Tableau
- Excel dashboards
These tools enable analysts to present data using charts, graphs, and other filters.
It is worth noting that a data analytics training program for students includes the building of dashboards, as the skill is very important.
Social Media Data Analysis
Social media sites generate a lot of data every day. Businesses use this information to understand audience engagement and content performance.
For this project, information from social media sites such as Instagram, Twitter, or YouTube can be used.
The objective of the project would be to identify patterns such as:
- What kind of information is getting the highest engagement?
- What is the best time to post information?
- Who is the audience?
- What are the trending topics?
The project would be of particular interest to career switchers and bootcampers as it would involve analytics and insights related to digital marketing.
Steps to Complete This Project
The steps that need to be followed to complete this project may include:
- Collecting information from social media sites
- Arranging the information
- Analyzing the information using SQL or Excel
- Using Power BI or Tableau for creating visualizations
- Presenting the results in the form of a dashboard
Students in a data analytics coaching institute would normally undertake such projects to understand the use of analytics in marketing strategies.
Hospital Analytics Project
The project in the hospital is about the analysis of the data with the aim of improving the operations of the hospital and the level of service provided to the patients.
The project entails the analysis of the data concerning the patients, the treatment of the patients, and the resources of the hospital with the aim of gaining useful insights.
The analysis of the data includes:
- Patient admissions
- Treatment of patients in various departments of the hospital
- Average stay of patients in the hospital
- Performance of doctors in the hospital
The tools used in the project:
- Microsoft Excel for the organization of the patients’ data
- SQL for the extraction of the hospital data
- Power BI or Tableau for the creation of the dashboard
The project can be used as an example of the application of the concepts of data analytics in the improvement of the healthcare industry.
How These Projects Help Freshers Get Hired
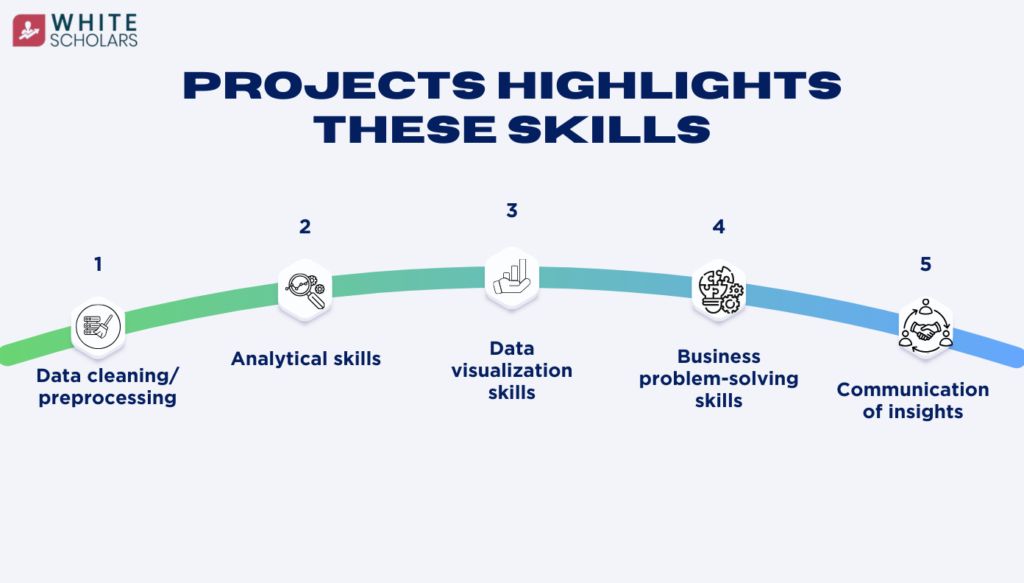
For graduates, interns, and job seekers, projects are important in an interview setting. Interviewers ask students to explain their projects in their portfolio.
A good project will help you showcase several important skills:
- Data cleaning/preprocessing
- Analytical skills
- Data visualization skills
- Business problem-solving skills
- Communication of insights
Students joining data analytics courses in Hyderabad or Bangalore, Mumbai must be aware that employers prefer students who can showcase practical skills rather than theoretical skills.
Bonus Tips for Building an Impressive Portfolio
There are a number of common issues that newbies face in creating projects. By avoiding these issues, you can improve your portfolio.
Some important tips are:
- Use real-world data instead of small-scale data
- Add visualizations to describe your insights
- Create a project explanation to describe your insights
- Publish your projects on GitHub or other portfolio websites
For SQL learners and new analysts, explaining the whole process will increase your credibility.
Conclusion
It may look difficult to start a career in data analytics, especially for freshers and people looking to switch their careers. However, building projects could make the process much more easier for you. Projects like sales analysis, customer segmentation, financial analysis, and social media analysis could help you prove your capabilities to employers.
Learning tools like SQL, Excel, Power BI, Tableau, and Python could help beginners gradually build their confidence and capabilities. Many people often look for a structured learning program like a data analyst training in hyderabad,chennai,Mumbai etc to get practical exposure.
The key to a successful career in data analytics is to start building your projects, keep learning, and keep improving your portfolio. Your projects could be the first step to your dream job as a data analyst.
FAQ’s
1. What is the importance of data analytics projects for freshers?
Freshers can use the projects to showcase their skills. Employers often look for freshers who have the ability to analyze the data and present their insights. Therefore, freshers should use the projects to showcase their skills.
2. What tools should freshers use for data analytics projects?
Freshers should start with Excel and SQL tools. They should then move on to Power BI or Tableau tools. They may later move on to Python.
3. How many projects should freshers use in their portfolio?
Freshers should use between three and five projects in their portfolio. They should ensure that the projects they use solve real-world problems. They should then use the projects to showcase their insights.
4. Can selflearners create data analytics projects without taking a course?
Yes, a selflearner can create a project using the available datasets and learning materials. However, a course like data analytics training provides the learner with the opportunity to access real-world datasets and mentoring, which could be beneficial to the learner.
5. Are dashboards significant for data analyst roles?
Yes, dashboards are used by many companies to aid their decision-making processes. Power BI and Tableau enable data analysts to create dashboards for the purpose of presenting their insights.