

Top 15 Data Analytics Skills Companies Want in 2026 & 2027
Data analytics is evolving rapidly. Discover the 15 essential skills companies will seek in 2026 and 2027 to build successful, future-ready analytics careers.
Introduction
Data Analytics has become essential for modern businesses, helping organizations understand data, identify trends, improve performance, and make informed decisions. As data continues to grow, so does the demand for skilled Data Analytics professionals.
In 2026 and 2027, companies are looking for professionals with skills in SQL, Excel, Python, Power BI, data visualization, statistics, and AI, along with strong communication and analytical thinking.
This blog explores the top 15 Data Analytics skills every company is hiring for in 2026 and 2027 and explains why each skill matters for a successful analytics career.
Why Are Data Analytics Skills Important in 2026 and 2027?
Data Analytics has become essential for modern organizations, helping businesses understand customers, improve performance, reduce costs, and make better decisions.
As analytics continues to evolve, companies expect professionals to work with different data sources, modern tools, AI technologies, and communicate insights clearly.
Developing a combination of technical, analytical, and communication skills can help Data Analysts adapt to changing industry requirements and contribute meaningful business insights.
1. SQL
SQL helps Data Analysts access, filter, and analyze data stored in databases. It is widely used for extracting data and answering business questions.
Key concepts include SELECT, WHERE, JOIN, GROUP BY, and HAVING.
2. Advanced Excel
Excel remains a widely used tool for Data Analytics. Advanced Excel skills help analysts clean, organize, analyze, and summarize data efficiently.
Key features include Pivot Tables, XLOOKUP, INDEX-MATCH, IF functions, and data validation.
3. Data Visualization
Data Visualization helps Data Analysts present complex data in a simple and understandable way. Clear charts and graphs make it easier to identify trends, patterns, and key insights.
Common techniques include bar charts, line charts, scatter plots, dashboards, and KPI reports.
4. Power BI
Power BI helps Data Analysts transform data, create interactive dashboards, and generate business insights. It is widely used for reporting and data visualization.
Key features include Power Query, DAX, data modeling, dashboards, and KPI reports.
5. Tableau
Tableau is a popular data visualization tool used to explore data and create interactive reports and dashboards.
It helps analysts identify trends, patterns, and business insights through visual analysis.
6. Python for Data Analytics
Python helps Data Analysts clean, analyze, and process data efficiently. It is especially useful when working with large or complex datasets.
Common libraries include Pandas, NumPy, Matplotlib, and Seaborn.
7. Statistics and Probability
Statistics helps analysts understand data, identify patterns, measure relationships, and support reliable decisions.
Important concepts include mean, median, standard deviation, correlation, probability, and hypothesis testing.
8. Data Cleaning and Data Preparation
Data cleaning helps analysts improve the quality, accuracy, and consistency of datasets before analysis.
Common tasks include handling missing values, removing duplicates, correcting errors, and transforming data.
9. Data Modeling
Data Modeling helps analysts organize data and establish relationships between different tables. A well-designed data model improves reporting accuracy and performance.
Key concepts include relationships, primary keys, foreign keys, and star schema.
10. Business Intelligence
Business Intelligence helps organizations analyze business data and support better decision-making. Data Analysts use BI tools to track performance and identify opportunities.
Key areas include reporting, dashboards, KPI tracking, and business performance analysis.
11. Generative AI and AI Tools
Generative AI is becoming increasingly useful in Data Analytics for automating repetitive tasks, exploring data, and generating insights.
Analysts can use AI tools for data exploration, report generation, query assistance, and workflow automation.
12. Machine Learning Fundamentals
Basic Machine Learning knowledge helps analysts understand how models can be used to identify patterns, make predictions, and support business decisions.
Important concepts include classification, regression, clustering, and model evaluation.
13. Data Storytelling
Data Storytelling helps analysts communicate data insights through clear narratives and visualizations. It makes complex findings easier for business stakeholders to understand.
A strong data story combines insights, visuals, context, and actionable recommendations.
14. Critical Thinking and Problem-Solving
Critical thinking helps analysts identify the right questions, evaluate data, and solve business problems effectively.
Strong problem-solving skills allow analysts to move beyond numbers and find practical, data-driven solutions.
15. Communication and Business Acumen
Communication and business acumen help analysts explain technical findings and understand business requirements.
Clear communication, stakeholder management, and knowledge of business goals help turn analytical insights into better business decisions.
Common Mistakes Beginners Make While Learning Data Analytics
Learning Data Analytics takes practice, and beginners may face challenges when working with different tools and datasets. Understanding these common mistakes can help improve accuracy and build stronger analytical skills.
1. Ignoring Data Cleaning
Analyzing unclean data can lead to incorrect results. Missing values, duplicates, and inconsistent data should be handled before analysis.
2. Focusing Only on Tools
Knowing tools such as Excel, SQL, Power BI, or Python is important, but understanding the business problem behind the data is equally important.
3. Using Incorrect Visualizations
Choosing the wrong chart can make insights difficult to understand. Analysts should select visualizations based on the type of data and the message being communicated.
4. Not Validating Results
Analytical results should be checked for errors, unusual values, and inconsistencies before being presented to stakeholders.
5. Ignoring Communication Skills
Even accurate analysis can lose its value if insights are not explained clearly. Strong communication and data storytelling help stakeholders understand the findings.
Build a Strong Foundation in Data Analytics
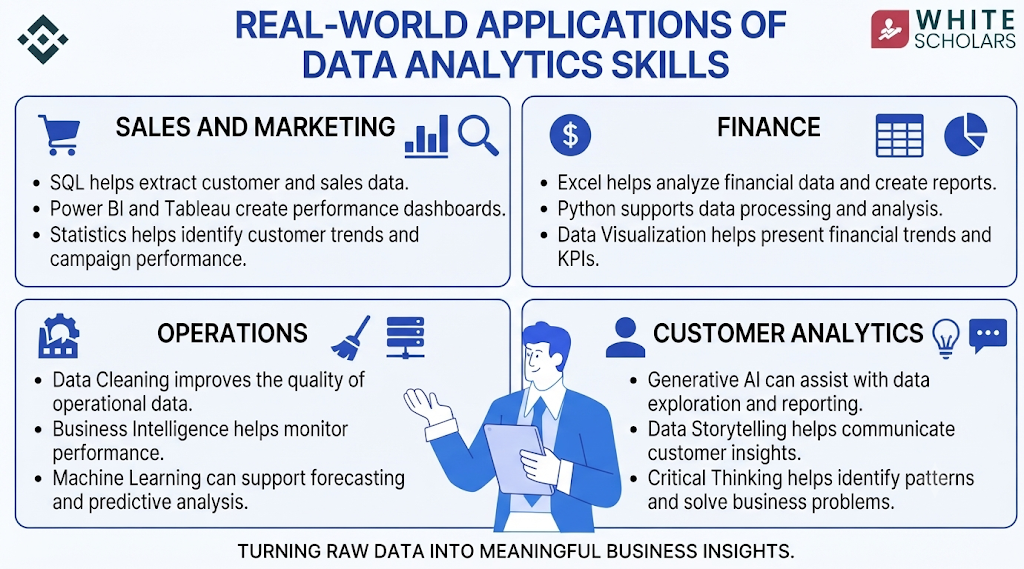
A strong foundation in Data Analytics helps professionals work confidently with data and solve real-world business problems. Understanding concepts such as SQL, Excel, statistics, data visualization, Python, Power BI, and data modeling can strengthen analytical skills.
Practical experience is equally important. Working on real-world datasets, projects, dashboards, and case studies helps aspiring Data Analysts apply their knowledge and develop job-ready skills. For learners looking to build these skills through structured training and practical exposure, a Data Analyst Course in Hyderabad at WhiteScholars can provide a useful learning environment to strengthen their foundation and prepare for analytics careers.
Salary and Career Growth
Data Analytics offers strong career opportunities as organizations increasingly depend on data-driven decision-making. Salaries can vary depending on experience, location, industry, company, and skill set.
Entry-level professionals can begin their careers as Data Analysts, Business Analysts, or Reporting Analysts. With experience, they can progress into roles such as Senior Data Analyst, BI Analyst, Analytics Consultant, or Data Analytics Manager.
Continuous learning and practical experience in areas such as SQL, Power BI, Python, AI, statistics, and data visualization can help professionals stay competitive and progress into senior positions.
How to Build Data Analytics Skills
Conclusion
Data Analytics skills are becoming increasingly important as companies continue to rely on data for better decision-making. Skills such as SQL, Excel, Power BI, Python, statistics, data visualization, AI, and data storytelling can help professionals meet changing industry requirements.
Building these skills through continuous learning, practical projects, and real-world experience can help aspiring Data Analysts develop stronger career opportunities and stay prepared for the evolving demands of the Data Analytics industry.
FAQs
1. What are the most important Data Analytics skills in 2026 and 2027?
Important skills include SQL, Excel, Power BI, Python, data visualization, statistics, AI, data storytelling, and business intelligence.
2. Is SQL still important for Data Analysts?
Yes. SQL remains an essential skill for accessing, filtering, querying, and analyzing data stored in databases.
3. Is Python necessary for a Data Analytics career?
Python is not required for every Data Analyst role, but knowledge of Python can help professionals with data cleaning, analysis, automation, and working with large datasets.
4. Which visualization tools should Data Analysts learn?
Power BI and Tableau are widely used for creating interactive dashboards, reports, and data visualizations.
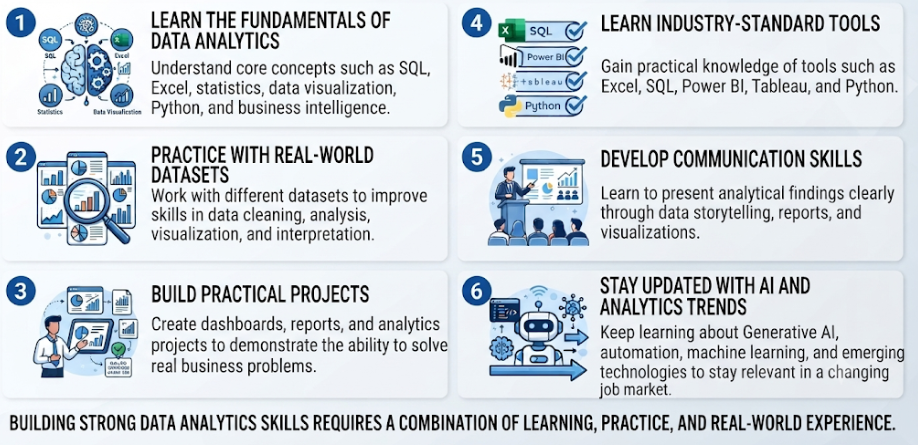
5. How can beginners improve their Data Analytics skills?
Beginners can improve their skills by learning industry-standard tools, practicing with real-world datasets, building projects, and continuously developing their technical and communication abilities.