Table of Contents Learn how to become a financial analyst step by step. Explore skills, tools, certifications, and data analytics courses for freshers. Introduction The demand for financial analysts continues to increase with the increasing use of financial decision-making based on financial data. Investigations have highlighted that more than 70% of companies use financial data […]
Take Your Marketing Journey to the Marketing Analyst Level
Table of Contents Learn how to move from marketing execution to a marketing analyst role. Understand analytics skills, tools, real projects, and career direction step by step. Introduction In today’s world, businesses use data to guide their decisions, and marketing analysts help them understand this data to improve results. In the last few years, investments […]
Skills vs Degree: What Matters Most in Tech & Marketing Careers
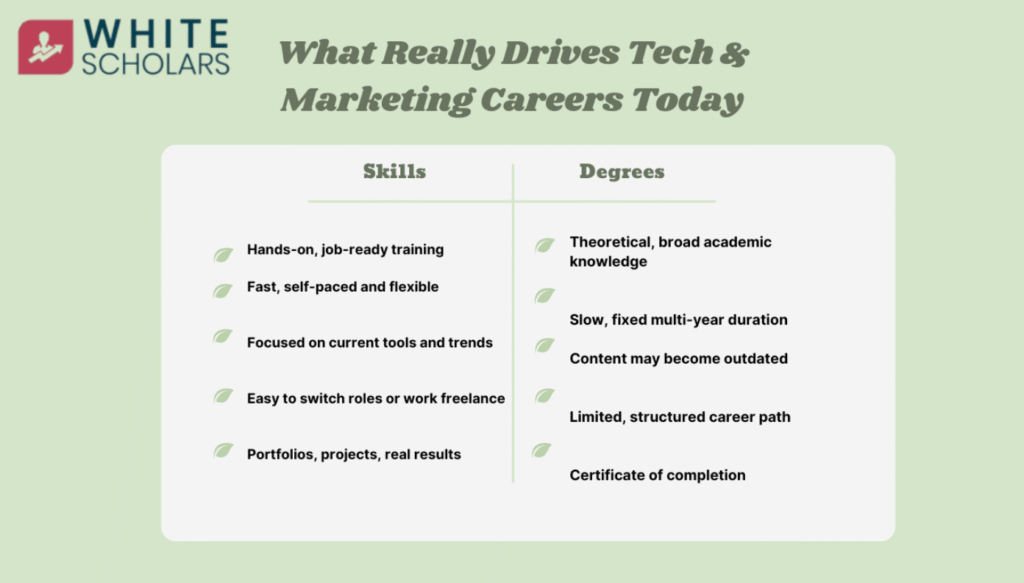
Table of Contents Skills vs degree explained. Discover what truly drives success in tech and marketing careers today and why skill-based hiring is changing the future. The Changing Hiring Landscape Recent studies reveal the emergence and prominence of a major change that has been witnessed within talent acquisition processes, especially within the technology and internet […]
Data Analyst vs Data Scientist: Roles, Skills & Career Differences
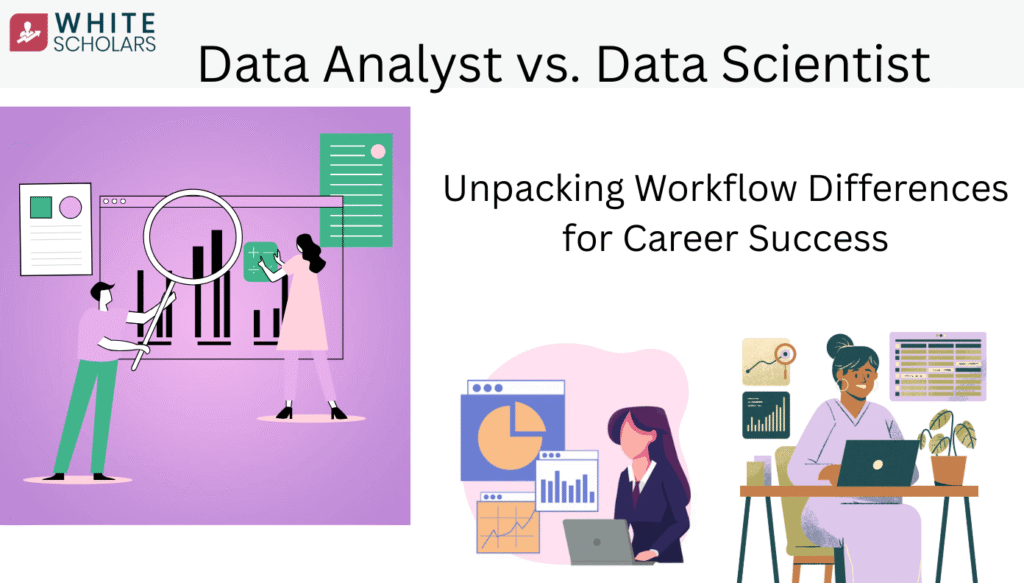
Table of Contents Data Analyst vs Data Scientist explained. Compare roles, skills, workflows, and career paths to choose the right data career. Data Analyst: Unveiling Insights Data analysts are the detectives of the data world. Their primary mission is to unravel the mysteries hidden within structured data sets. Armed with statistical techniques and visualization tools, […]
A Day in the Life of a Data Analyst: What the Job Really Looks Like
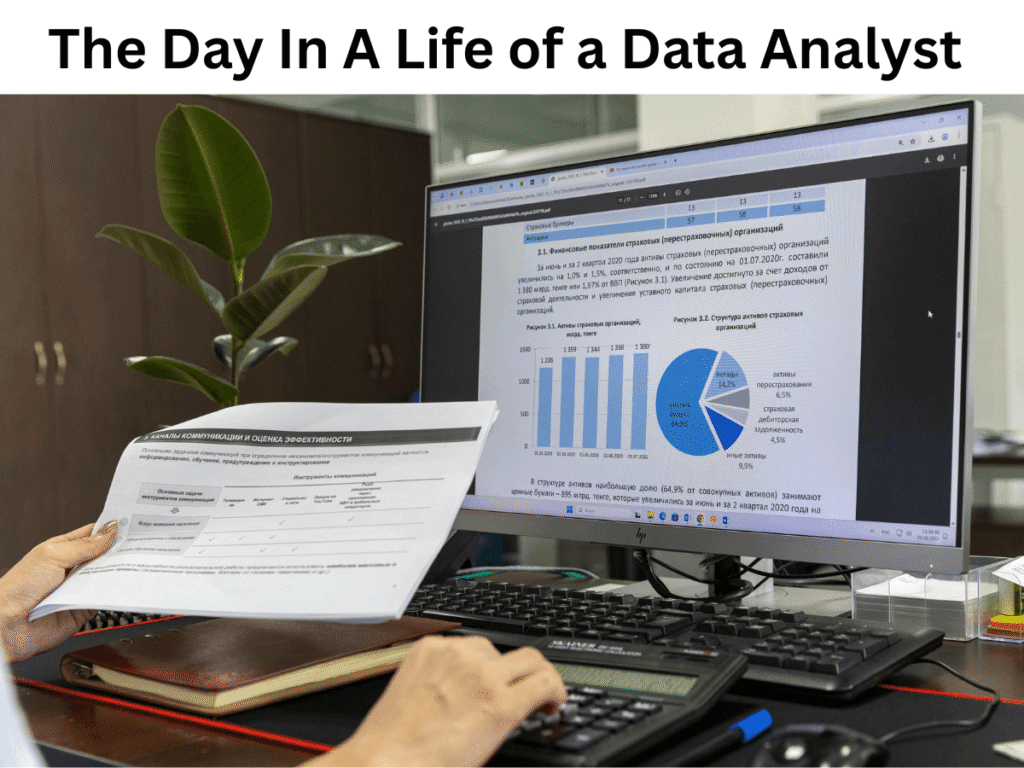
Table of Contents A day in the life of a Data Analyst covering daily tasks, skills, tools used, and how training in Hyderabad prepares you for the role. Introduction Many people will say a data analyst sits in front of their terminal and writes SQL queries all day, or creates charts. In fact, thats just […]
Auditing Re-Invented: Role of Data Analytics in Modern Audits
Table of Contents Learn how data analytics is embedded in auditing to improve audit quality, accuracy, and efficiency in modern audit practices. Defining an Audit So, what is an audit? In simple terms, an audit is a systematic and independent examination of books, accounts, documents, and vouchers of an organization. Its main aim is to […]
Why Clean Data Is the Backbone of Every Analytics Decision
Table of Contents Discover why clean, structured data is the foundation of data analytics, how analysts clean data, and the tools used to create real insights. Introduction Daily a large amount of data is generated and collected by various institutions. Despite this data volume analysis and meaningful information are not generated. Unorganized and unclear data […]
From Non-Technical to Data Analyst: A Step-by-Step Career Guide
Table of Contents A simple step-by-step guide to help non-technical professionals transition into a data analyst career and build a rewarding future. Data Analyst – how to start your career with a non-technical background Interested in joining the data analytics world? Not sure where to start? Are more and more questions popping into your head? […]
How to Prepare Data Analytics Interview Questions Like a Pro
Table of Contents Learn how to prepare for data analytics interview questions with smart tips, key topics, and simple strategies to answer confidently like a pro. Introduction Data analytics interview preparation seems to be a big hassle, especially for freshers and career switchers. While companies expect technical knowledge and practical thinking too, the preparation for […]
Learn Data Analytics Even If You Are From a Non-Technical Background
Table of Contents Learn data analytics from non technical background by understanding fundamentals, working on real projects, and developing job-ready analytical skills step by step. What is Data Analytics? Data analytics is the science of analyzing raw data sets to extract meaningful insights that can help businesses make better decisions. It is frequently referred to […]


