

Descriptive vs Diagnostic vs Predictive Analytics
Understand descriptive, diagnostic, and predictive analytics with real examples. Learn how businesses use data to analyze past trends and forecast future growth.
Introduction
Did you know that over 90% of the world’s data has been generated in just the last few years? Every click, purchase, search, and swipe is being stored somewhere. But collecting data is not enough. What really matters is understanding it.
This is where analytics comes in.
If you are a fresher planning to build a career in data analytics, you must clearly understand the difference between these three: descriptive, Diagnostic, and predictive analytics. These three are the building blocks of modern business intelligence.
In this blog, you will learn:
- What each type of analytics means
- Examples from the corporate world
- Tools and techniques used in data analytics
- How these topics can make you job-ready
How training courses such as a data analytics course in cities like Mumbai, Chennai, Bangalore, and Hyderabad can help freshers.
Let’s explain it in simpler terms.
Descriptive Analytics: What Happened?
Descriptive analytics is the first type of data analysis. It is focused on understanding the past data. Reports, dashboards, and summaries are generated to present what has already happened.
For example:
A retail company checks the sales report of the last month. It finds that 10,000 units were sold, and the sales figure touched ₹50 lakhs. This is descriptive analytics. It answers the question, “What happened?”
Most businesses start here because it provides a clear view of performance.
Descriptive analytics is commonly used in:
Monthly sales reports
- Monthly sales reports
- Website traffic dashboards
- Social media engagement reports
- Financial summaries
Without this stage, deeper analysis cannot be performed.
Tools and Skills Used in Descriptive Analytics
To perform descriptive analytics, the following tools are commonly used:
- Excel
- SQL
- Power BI
- Tableau
Important skills include:
- Data cleaning
- Data visualization
- Basic statistics
- Report creation
These basics are normally taught in data analytics training courses. Many beginners join a data analyst course in tech hubs such as Hyderabad to develop strong reporting skills before progressing to more advanced methods.
Diagnostic Analytics: Why Did It Happen?
Once the past performance is understood, the next step is to identify the cause of this performance. This is diagnostic analytics.
It responds to, “Why did this occur?”
For example:
If there was a decline in sales in a particular region, the firm digs deeper. Perhaps it finds that the prices of their products were higher than the competitors’ or that the marketing budgets had been cut. The underlying cause is determined by further analysis.
Diagnostic analytics includes:
- Data comparison
- Correlation identification
- Pattern recognition
- Customer behavior segmentation
It is more than just reporting and requires analytical thinking.
Methods and Techniques Used
Some commonly used techniques include:
- Drill-down analysis: allows deeper exploration of data by moving from summary reports to detailed levels
- Data segmentation: breaks down data into segments for analysis.
- Correlation analysis reveals the relationship between variables.
- Root cause analysis: assists in identifying the root cause of a problem using specific methods of investigation.
SQL, Python, and Power BI are some of the tools that are most commonly used to conduct these investigations. Logical reasoning and problem-solving skills are also required during this phase.
An effective data analytics coaching institute usually focuses on case studies where students learn to identify business problems and their causes. In Hyderabad, students mostly prefer classroom or online courses to gain hands-on exposure.
Predictive Analytics: What Will Happen Next?
Predictive analytics takes it a step ahead. It uses past data to predict future results.
It asks, “What is the likely outcome?”
For example:
An online shopping business uses past purchase data of customers to predict who will likely purchase again. Based on the prediction, customized offers are sent.
Banks use predictive models to determine the risk of lending. Hospitals use predictive models to predict outbreaks of diseases. Marketing teams use predictive models to forecast the performance of marketing campaigns.
Predictive analytics uses:
Machine learning algorithms: Predictive analytics employs machine learning algorithms to detect patterns and make predictions.
Statistical models: Statistical models examine probability and relationships between variables.
Regression analysis: Regression analysis determines the effect of one variable on another
Time-series forecasting: Time-series forecasting examines past trends to predict future outcomes such as sales, demand, or growth.
Skills and Mistakes to Avoid
To work in predictive analytics, knowledge of:
- Python
- R
- Statistics
- Machine Learning
- Data modeling
Familiarity with all these tools is required.
Common mistakes beginners make:
- Ignoring data quality
- Overfitting models
- Not validating results
- Misinterpreting patterns
These can be avoided through structured data analytics training and practical projects.
Comparison of the Three Types
To make it simple:
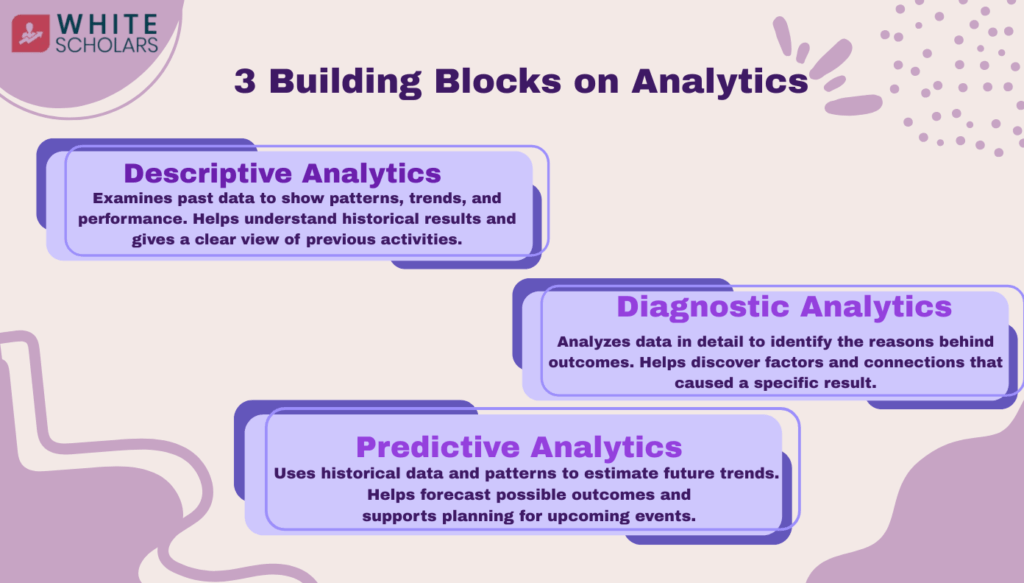
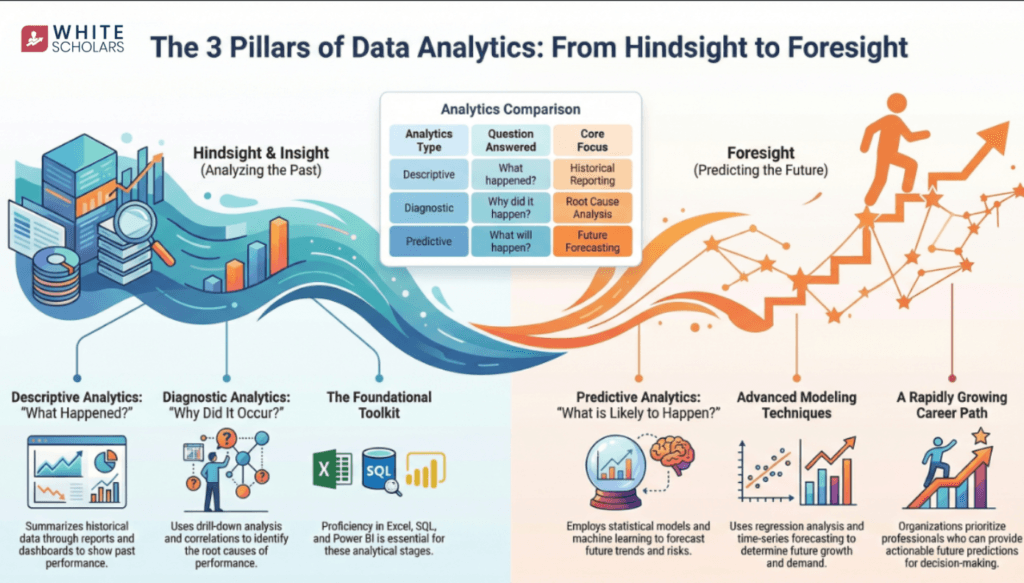
- Descriptive Analytics – Shows what happened
- Diagnostic Analytics – Explains why it happened
- Predictive Analytics – Forecasts what may happen next
Descriptive Analytics – shows What Has Happened:
Descriptive analytics is all about historical data. It involves the summary of historical data in the form of reports, dashboards, and graphical representations. For example, a firm analyzing sales performance in the previous quarter is using descriptive analytics. It answers very basic questions such as total sales, number of customers, or growth in a particular month. It provides a very clear view of what happened in the past but does not provide any reason for it.
Diagnostic Analytics – Provides Reasons for What Has Happened
Diagnostic analytics takes it a step further. It involves the analysis of data to establish the cause of a certain outcome. For example, if the sales had been low in a certain region, further analysis may reveal higher prices or less marketing. It employs comparison, patterns, and relationships to determine the reason. This type of analytics helps firms understand issues and implement changes.
Predictive Analytics- Predicts What May Happen in the Future
Predictive analytics employs historical data, statistical models, and machine learning algorithms to predict future results. For example, predicting customer churn or forecasting next month’s demand. It helps organizations prepare for risks and opportunities by making informed future decisions.
All three are connected. Businesses usually move step by step from reporting to forecasting.
For freshers, it is recommended that strong fundamentals be built first. Many beginners in Hyderabad begin their journey through a data analytics training that covers Excel, SQL, Power BI, and Python before moving into advanced modeling.
Why Understanding This Matters for Your Career
If you are looking to pursue a career in data analytics, these three concepts are the foundation of all interviews and projects.
Companies require professionals who can:
- Create dashboards
- Analyze business problems
- Interpret data logically
- Provide future predictions
This requires strong analytical skills, communication skills, and knowledge of tools. A good data analyst course will help you gain experience with live data and real-world scenarios.
The requirement for analytics professionals is increasing at a rapid pace. It is reported that data-related jobs are among the fastest-growing types of employment worldwide.
Conclusion
Descriptive, diagnostic, and predictive analytics are collectively the pillars of modern data analysis. Descriptive analytics helps understanding of past performance, diagnostic analytics reveals the reasons behind outcomes, and predictive analytics enables the preparation for the future that may come. When combined, they support smarter and more confident decision-making.
For a beginner, the ability to learn these basics is the first step towards a successful career in data analytics. Learning tools such as Excel, SQL, Power BI, and Python, and learning logical thinking and problem-solving skills, is the foundation for success.
The demand for analytics professionals is rising as more and more businesses are using data-driven decision-making. By focusing on applications, learning, and application, a successful career path can be achieved. A strong foundation in the current world can result in success in this ever-changing world.
FAQs
1. What is the difference between descriptive and predictive analytics?
Descriptive analytics is the process of explaining past occurrences through reporting and summarization. Predictive analytics is the process of using historical data and statistical models to predict future occurrences. Both are valuable but for different reasons.
2. What tools are needed to begin learning data analytics?
Learning data analytics begins with Excel, SQL, and Power BI. Later, Python and machine learning are introduced for advanced learning.
3. Is coding necessary for predictive analytics?
Yes, basic coding knowledge in Python or R is necessary for predictive modeling. However, basic analytics doesn’t require coding; it can be done using visualization tools.
4. How can freshers begin a career in data analytics?
It is advised to take formal data analytics training, work on projects, and develop strong fundamentals. Practice is key.
5. Why is Hyderabad a popular destination for learning analytics?
Hyderabad has a thriving IT sector and has many reputable institutions. A data analytics coaching institute in Hyderabad typically offers industry-relevant learning and placement assistance.