

Power BI Dashboard: The Complete Guide to Smarter Business Decisions in 2026
Introduction
The importance of using data has increased for many businesses. But data collection alone will not get you insights. Companies will need specialized visualization tools to see data in cumbersome reports. Microsoft Power BI Dashboards is one of those tools.
Microsoft Power BI is one of the best analytic tools because of its usability to aggregate and connect many disparate data sources to develop interactive visualizations that will also provide analytics to empower organizations to make informed, faster, and smarter decisions.
Be it a start-up, an SME, or an Enterprise, the usability of the Power BI dashboard by any organizational structure can better visibility and performance of the business.
What is a Power BI Dashboard?
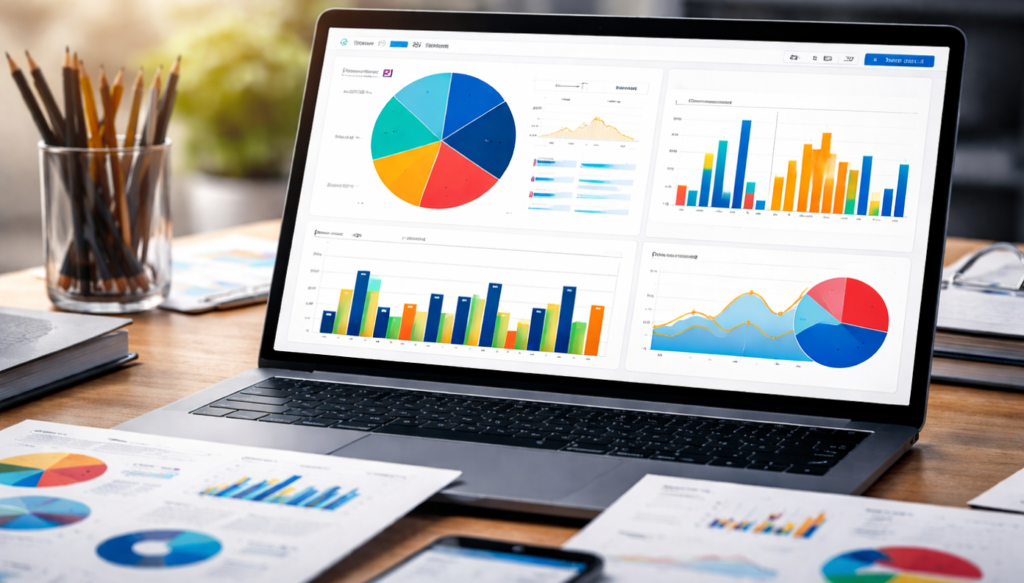
A Power BI Dashboard is a real-time interactive report that is used to visualize and display essential metrics and KPIs. Unlike a traditional report, dashboards allow users to see a consolidated view of a business and evaluate and aggregate multiple data sets at once.
Some of the data sources that can be used in the Power BI dashboards include:
- Excel
- SQL
- Azure
- Salesforce
- Google Analytics
- ERP and CRM Systems
- Cloud Applications
- APIs
- Third Party Business Applications
Why Businesses Need a Power BI Dashboard in 2026
The use and application of data in the business world has exponentially increased. This is evidenced by the millions of transactions, customer engagements, interactions, and operating records that every business has to aggregate, evaluate, and analyze on a daily basis.
Identifying trends and making decisions is impossible without visualization of the data.
Some of the other advantages of a Power BI Dashboard for business intelligence are that it enables businesses to:
- Evaluate and monitor performance
- Identify trends in business
- Enhance the accuracy of forecasting
- Monitor KPIs by department
- Minimize reporting
- Create organizational agility
- Streamline collaboration across all business units and departments
- Enable business leaders to make timely decisions.
Main features of a Power BI dashboard
Real-Time Data Monitoring: Get live business data continuously updated for you to facilitate prompt decisions.
Interactive Visualizations: Interact with data using a series of dynamic charts, graphs, maps, and filters.
Multiple Data Sources: Data can be pulled directly from Excel, SQL Server, Azure, Salesforce, Google Analytics, and many more.
Customizable Dashboards: Create dashboards that display important metrics and KPIs that are the most vital to your company.
AI-Powered insights: Make use of AI-powered insights from the software’s AI capabilities to analyze trends, forecasting, and detection of anomalies.
Mobile Access: Access and interact with dashboards at any moment via your tablet, desktop, or mobile.
Secure Data Security: Secure sensitive data by granting access via role-based encryption, encryption, and Microsoft security protocols.
Sharing and collaboration: Allows collaborative sharing by allowing users to share dashboards and other information within the groups that they belong to.
Advantages of a Power BI Dashboard
Real-Time information: Check real-time business data and make quicker decisions with a better understanding of the information.
Better Decision-Making: Benefit from the data you usually find in reports and convert it into actionable data and interactive visualisations.
Improved Business Intelligence: Centralized dashboards give you a complete view of how your business is doing.
Increased efficiency: Streamline the reporting process with less manual work and save valuable time.
Better collaboration: Dashboards and reports can be securely shared between teams, promoting cross-team collaboration.
Performance monitoring that is based on data: Track key performance indicators (KPIs) and business metrics to spot trends and opportunities.
Cost Efficiency: Make reporting more cost-effective by automating data collection, analysis, and visualization.
Scalable and Flexible: The dashboards are designed to adapt to an evolving business and a growing organization.
Industries That Benefit from Power BI Dashboards
E-commerce and Retail: We track the performance of sales, customer behaviour, and inventory trends, as well as sales trends in our retail stores.
Healthcare: Hospitals keep track of information, operations, resource utilization, and treatment outcomes to enhance care.
Banking: Businesses examine their cash flow, performance budgeting, risk, and performance in order to make informed decisions.
Manufacturing: Factories enhance the efficiency of production as well as quality control and visibility into the supply chain to remain in the race to stay.
Education: Schools measure student performance, attendance, admissions, and key performance indicators to enhance learning.
Logistics & Supply Chain: Business owners can improve logistics management and delivery tracking, as well as warehouse operations and inventory, to improve logistics.
Marketing: Teams assess the performance of campaigns and lead generation, as well as pipelines for sales and customer acquisition to boost sales.
HR (HR): Departments monitor the performance of employees, their recruitment metrics, as well as workforce analytics and retention rates to monitor employees’ skills.
Power BI Dashboard Best Practices
Create clear goals for the business. We create the Power BI Dashboard with KPIs in mind and business goals to gain meaningful insight.
Maintain your Dashboard Simple: A simple dashboard that includes relevant metrics is simpler to understand and understand.
Make use of consistent visuals: Uniform colors, fonts, and chart styles ensure that the Power BI Dashboard looks professional and easy to comprehend.
Choose the Right Visualizations: Bar charts, line graphs, KPI cards, and maps help represent business data in a way.
Optimize Dashboard Performance: We minimize visuals and optimize data models for fast-loading dashboards.
Enable Interactive Filtering: Slicers, filters, and drill-through options enhance users’ experience and exploration of data.
Refresh Data Frequently: Refreshing data automatically ensures that the Power BI Dashboard for business intelligence is up-to-date.
Ensure Data Security: Role-based access and governance policies protect business information while sharing dashboards securely.
Common Problems Companies Have with a Power BI Dashboard
Poor Data Quality: If the data is not correct or is missing, then the information we get from it is not reliable.
Multiple Data Sources: It is hard to combine data from systems.
Slow Dashboard Performance: If the datasets are too big and the models are not good then the dashboard is slow.
Complex Dashboard Design: If there are many visuals the Power BI Dashboard is hard to understand.
Lack of User Training: Employees have a time using the dashboard features if they do not get proper training.
Data Security Concerns: We need to protect business information with strong controls.
Frequent Data Updates: It is hard to keep the data up to date and correct all the time.
Scalability Problems: As companies grow the dashboards need to be able to handle data.
What To Await from Power BI Dashboards in 2026
The Power BI Dashboard Development Services for Businesses are getting better because of technologies like AI and cloud computing. In 2026, businesses will use Power BI Dashboards that’re smarter and can tell us what might happen in the future, make reports automatically, and help people work together better. This will help businesses make decisions faster and work more efficiently.
Some new things we can expect from Power BI Dashboards include:-
- Powered by insights and predictive analytics to help us make good decisions
- We can ask questions in the language to make it easier to look at the data
- The data will be updated in time, and the dashboards will be live
- Power BI Dashboards will work better with Microsoft Fabric and cloud platforms
- We can put analytics inside the business applications we use every day
- The data will be safer and more secure
- We can make dashboards without needing to know how to code
- It will be easier to work and share reports because everything is in the cloud.
Getting Started with a Power BI Dashboard for Business Intelligence
To begin with a Power BI Dashboard for business intelligence, you need to figure out what your company wants to achieve and what is important to track. You have to get all your business information from places that make sense of it and put it together in a way that is easy to understand. Then you build dashboards that’re interactive and give you useful information. You should check how things are going all the time, update your information and make your dashboards better so that you can make decisions.
Here are the steps to follow:-
- Define what your company wants to do and what is important to measure.
- Get information from all the systems your company uses.
- Verify that the data you’ve input is complete and suitable to use.
- Design dashboards simple to use and fun.
- Choose the way to show your information.
- Share your dashboards with the people who need to see them in a way.
- Set up your information to update so you always have the latest numbers.
- Keep making your dashboard better based on what people say and what your company needs.
Conclusion
A Power BI Dashboard is an important tool for companies that want to use their information to make good decisions. If you follow this Power BI Dashboards guide, your company can build dashboards that’re interactive, safe, and work well. Power BI helps companies by giving them the information using artificial intelligence and letting them customize how they see their information. This means companies can stay competitive and make decisions based on their information in 2026 and after that. Power BI Dashboard is what you need to make your company better. With a Power BI Dashboard, you can make your company run smoothly and grow over time.
