

Top 15 Power BI DAX Functions Every Beginner Should Know

Still struggling with DAX? Learn the top 15 Power BI DAX functions with simple examples to build smarter reports faster.
What Are Power BI DAX Functions?
Creating visually appealing dashboards is only the first step in Power BI. The real magic happens when reports become dynamic, interactive, and capable of answering complex business questions and that’s where Power BI DAX functions come into play.
DAX (Data Analysis Expressions) is the powerful formula language that powers calculations in Power BI. From calculating total sales and profit margins to tracking year-over-year growth, building dynamic KPIs, and ranking top-performing products, DAX functions in Power BI make it possible to turn raw data into meaningful business insights.
At first glance, DAX formulas in Power BI may seem interesting, especially for beginners. However, learning a handful of essential functions can dramatically improve reporting skills and make dashboard creation faster, smarter, and more efficient. Instead of relying on manual calculations, users can leverage DAX functions to automate complex business logic and create reports that update instantly as data changes.
This comprehensive Power BI DAX functions list introduces the top 15 DAX functions in Power BI with examples that every beginner should master. Each function is explained with practical use cases, helping aspiring data analysts and Power BI professionals understand not only how these formulas work but also when to use them in real-world business scenarios.
Whether the goal is to build interactive dashboards, perform advanced calculations, or gain deeper insights from data, mastering these Power BI DAX functions is an essential step toward becoming a confident Power BI developer.
Why Are DAX Functions Important in Power BI?
Power BI is much more than a data visualization tool it is a powerful analytics platform that helps businesses make informed decisions. While charts and graphs present the data, Power BI DAX functions provide the intelligence behind those visuals by enabling users to perform custom calculations, analyze trends, and generate meaningful insights.
Without DAX functions in Power BI, users are limited to basic reporting. DAX makes it possible to calculate key business metrics such as revenue, profit, growth percentage, customer retention, and year-over-year comparisons. It also allows reports to respond dynamically to filters and slicers, creating interactive dashboards that deliver deeper insights with just a few clicks.
Another major advantage of DAX formulas in Power BI is automation. Instead of performing repetitive calculations manually, users can create reusable measures that update automatically whenever the underlying data changes. This not only saves time but also reduces errors and ensures reports remain accurate.
From financial analysis and sales reporting to HR dashboards and inventory management, DAX functions are used across industries to solve real business problems. Mastering these functions helps beginners move beyond static reports and build professional dashboards that answer complex business questions with ease.
By understanding the most commonly used Power BI DAX functions, aspiring data analysts and business intelligence professionals can create smarter reports, improve decision-making, and unlock the full potential of Power BI.
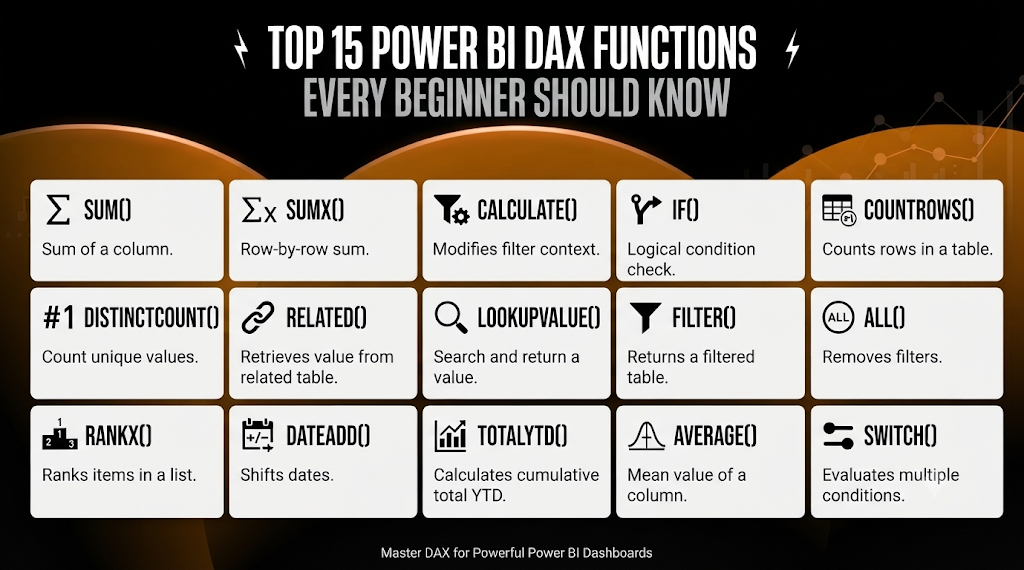
1. SUM()
The SUM() function adds all the values in a column. It is one of the first and most commonly used Power BI DAX functions for calculating totals.
Example:
Total Sales = SUM(Sales[SalesAmount])
If the SalesAmount values are 1000, 2000, and 3000, the result will be 6000. This function is commonly used to calculate total sales, profit, or quantity sold.
2. SUMX()
Unlike SUM(), SUMX() performs a calculation for each row before adding the final result. This makes SUMX() useful when values need to be multiplied or calculated first.
Example:
Total Revenue = SUMX(Sales, Sales[Quantity] * Sales[Price])
If a product has a quantity of 2 and a price of 500, and another has a quantity of 3 and a price of 400, the total revenue will be 2200.
3. CALCULATE()
The CALCULATE() function changes the filter context before performing a calculation. It is one of the most powerful DAX functions in Power BI.
Example:
South Sales =
CALCULATE(
SUM(Sales[SalesAmount]),
Sales[Region] = “South”)
This formula returns the total sales only for the South region.
4. IF()
The IF() function checks whether a condition is true or false and returns the corresponding result.
Example:
Performance = IF(Sales[SalesAmount] > 1000, “High”, “Low”)
If the sales amount is greater than 1000, the result is “High”; otherwise, it returns “Low”.
5. COUNTROWS()
The COUNTROWS() function counts the number of rows in a table.
Example:
Total Orders = COUNTROWS(Sales)
If the Sales table has 500 rows, the result will be 500.
6. DISTINCTCOUNT()
The DISTINCTCOUNT() function counts only unique values in a column.
Example:
Unique Customers = DISTINCTCOUNT(Sales[CustomerID])
If the Customer IDs are 101, 102, 101, 103, the result will be 3.
7. RELATED()
The RELATED() function retrieves data from another table that has a relationship with the current table.
Example:
Category = RELATED(Product[Category])
It returns the corresponding product category from the Product table.
8. LOOKUPVALUE()
The LOOKUPVALUE() function searches another table and returns the matching value.
Example:
Product Price =
LOOKUPVALUE(
Product[Price],
Product[ProductID],
Sales[ProductID])
If the Product ID matches, it returns the corresponding product price.
9. FILTER()
The FILTER() function returns only the rows that satisfy a condition.
Example:
FILTER(Sales, Sales[SalesAmount] > 1000)
This returns only those sales records where the sales amount is greater than 1000.
10. ALL()
The ALL() function removes filters from a table or column before performing a calculation.
Example:
Total Sales =
CALCULATE(
SUM(Sales[SalesAmount]),
ALL(Sales))
This returns the overall sales, even if slicers or filters are applied.
11. RANKX()
The RANKX() function ranks values from highest to lowest or vice versa.
Example:
Product Rank =
RANKX(
ALL(Product),
SUM(Sales[SalesAmount]))
It ranks products based on their total sales.
12. DATEADD()
The DATEADD() function shifts dates forward or backward by a specified period.
Example:
Previous Year Sales =
CALCULATE(
SUM(Sales[SalesAmount]),
DATEADD(Date[Date], -1, YEAR))
This returns the sales from the previous year.
13. TOTALYTD()
The TOTALYTD() function calculates the total value from the beginning of the year up to the selected date.
Example:
YTD Sales =
TOTALYTD(
SUM(Sales[SalesAmount]),
Date[Date])
It is widely used for Year-to-Date sales and financial reporting.
14. AVERAGE()
The AVERAGE() function returns the average of all values in a column.
Example:
Average Sales = AVERAGE(Sales[SalesAmount])
If the sales values are 1000, 2000, and 3000, the average will be 2000.
15. SWITCH()
The SWITCH() function checks multiple conditions and returns the matching result.
Example:
Performance =
SWITCH(
TRUE(),
Sales[SalesAmount] > 5000, “Excellent”,
Sales[SalesAmount] > 2000, “Good”,
“Average”)
If the sales amount is 6000, the result will be “Excellent”. It is easier to read than using multiple IF() statements.
Real-World Examples of DAX Functions in Power BI
Learning individual Power BI DAX functions is important, but understanding how they solve real business problems is what truly builds confidence. In day-to-day reporting, data analysts often combine multiple DAX functions in Power BI to create interactive dashboards and meaningful business insights.
Here are a few practical examples:
Sales Dashboard
A retail company wants to track its sales performance.
- SUM() calculates the total sales.
- SUMX() calculates total revenue by multiplying quantity and price.
- CALCULATE() displays sales for a specific region or product category.
Customer Analysis
A business wants to understand its customer base.
- DISTINCTCOUNT() counts unique customers.
- COUNTROWS() shows the total number of orders.
- LOOKUPVALUE() retrieves customer details from another table.
Time-Based Reporting
A company wants to compare current sales with previous periods.
- DATEADD() compares sales with the previous month or previous year.
- TOTALYTD() calculates Year-to-Date (YTD) sales performance.
Product Performance
A manager wants to identify the best-selling products.
- RANKX() ranks products based on sales.
- FILTER() displays only products that meet specific sales criteria.
- ALL() calculates the overall sales without any filters.
Performance Dashboard
A business wants to categorize employee performance.
- IF() labels employees as “High Performer” or “Needs Improvement.”
- SWITCH() assigns performance ratings such as Excellent, Good, or Average.
- AVERAGE() calculates the average sales achieved by employees.
These examples show that DAX formulas in Power BI are not used in isolation. Instead, they work together to create dynamic reports, automate calculations, and help businesses make faster and more informed decisions. As beginners become familiar with these Power BI DAX functions, building professional dashboards becomes much easier and more efficient.
Common Mistakes Beginners Make While Writing DAX Formulas
Learning Power BI DAX functions takes practice, and it’s completely normal for beginners to make mistakes along the way. Understanding these common errors can save time, improve accuracy, and make writing DAX formulas in Power BI much easier.
1. Using SUM() Instead of SUMX()
Many beginners use SUM() when they actually need SUMX(). Remember, SUM() simply adds the values in a column, while SUMX() performs a calculation for each row before adding the results.
2. Ignoring Relationships Between Tables
Functions like RELATED() and LOOKUPVALUE() work correctly only when the data model is designed properly. Missing or incorrect relationships often lead to incorrect results.
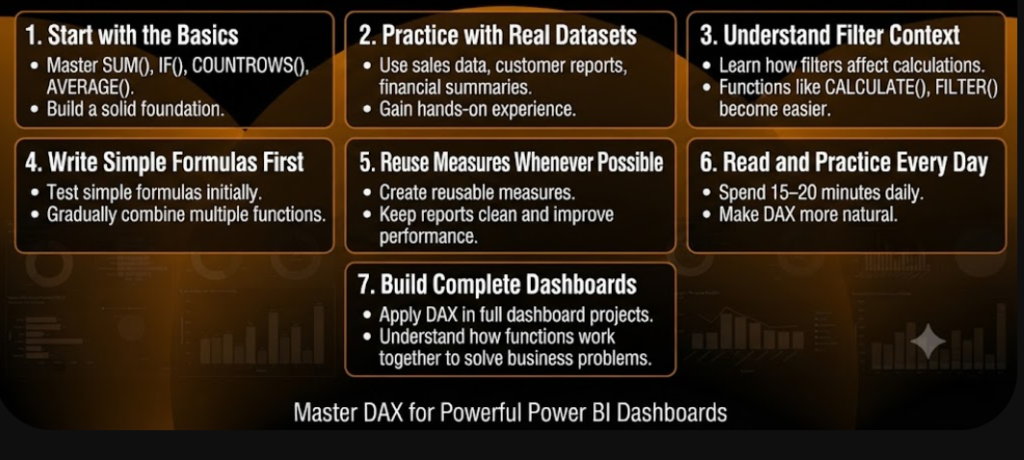
3. Forgetting About Filter Context
One of the biggest challenges in DAX is understanding filter context. Functions like CALCULATE() change the filter context, so beginners should carefully check which filters are being applied before creating calculations.
4. Writing Complex Formulas Too Early
Many new users try to create advanced formulas from the beginning. A better approach is to first master basic DAX functions such as SUM(), IF(), COUNTROWS(), and AVERAGE() before moving on to more advanced calculations.
5. Not Testing Formulas Step by Step
Instead of writing a long formula all at once, create and test it in smaller parts. This makes it much easier to identify and fix errors.
6. Using Hard-Coded Values
Avoid entering fixed values directly into formulas whenever possible. Using columns, measures, or variables makes DAX functions in Power BI more flexible and easier to maintain as the data changes.
7. Not Giving Measures Clear Names
Meaningful names like Total Sales, Average Profit, or Customer Count make reports easier to understand and maintain, especially when working on large Power BI projects.
By avoiding these common mistakes and practicing regularly, beginners can build confidence with Power BI DAX functions and create cleaner, more efficient reports. Over time, writing DAX formulas becomes much more intuitive, helping users build professional dashboards with ease.
Learn Power BI DAX with WhiteScholars
Mastering Power BI DAX functions is one of the most valuable skills for anyone looking to build a career in data analytics or business intelligence. While understanding the theory is important, real expertise comes from working on live projects and solving real business problems.
The WhiteScholars Power BI Course is designed to help beginners and professionals learn Power BI from the ground up. The course covers everything from data cleaning and visualization to advanced DAX functions in Power BI, Power Query, data modeling, dashboard design, and real-world business reporting.
What you’ll learn in the course:
- Power BI fundamentals and data visualization
- Data cleaning and transformation using Power Query
- Writing DAX formulas in Power BI for custom calculations
- Building interactive dashboards and KPI reports
- Data modeling and relationships
- Real-time projects and case studies
- Dashboard optimization and best practices
With hands-on training, expert guidance, and industry-focused projects, learners gain the practical experience needed to confidently use Power BI DAX functions and build professional dashboards. Whether you’re a student, a working professional, or someone looking to switch careers, the WhiteScholars Data Analytics Course in Hyderabad provides the skills required to become job-ready in today’s data-driven world.
Conclusion
Mastering Power BI DAX functions is key to creating smarter, more interactive reports and dashboards. By learning these essential DAX functions in Power BI and practicing them with real-world datasets, beginners can perform advanced calculations, automate reporting, and gain valuable business insights. Start applying these DAX formulas in Power BI today, and you’ll be well on your way to becoming a confident Power BI professional.
FAQs
1. What are Power BI DAX functions?
Power BI DAX functions are built-in formulas used to perform calculations, create measures, calculated columns, and tables in Power BI. They help users analyze data, automate calculations, and build interactive dashboards.
2. What is the difference between SUM() and SUMX() in Power BI?
SUM() simply adds all the values in a column, while SUMX() first performs a calculation for each row and then adds the results together. SUMX() is useful when calculations involve multiple columns.
3. Which DAX functions should beginners learn first?
Beginners should start with functions like SUM(), SUMX(), CALCULATE(), IF(), COUNTROWS(), DISTINCTCOUNT(), FILTER(), and AVERAGE(). These are among the most commonly used DAX functions in Power BI.
4. What is LOOKUPVALUE() used for in Power BI?
LOOKUPVALUE() searches another table and returns a matching value based on a specified condition. It is commonly used to retrieve details such as product prices, customer names, or employee information.
5. What does DATEADD() do in Power BI?
The DATEADD() function shifts dates forward or backward by a specified period, such as days, months, or years. It is commonly used to compare current performance with previous months or years.
