

Beginner’s Roadmap: Start Doing These Smart Moves to Stand Out in Data Analytics

Beginner’s roadmap to data analytics with practical steps and Smart Moves to Stand Out in Data Analytics and build a strong foundation.
What is Data Analytics
Data analytics is a field that is both practical and future-proof for beginners looking to enter technology without needing extensive coding backgrounds.
Data analytics is the process of collecting, cleaning, analysing, and interpreting data in order to answer specific questions and make decisions. In the modern industrial landscape, especially in 2026, companies rely more heavily than ever on data to inform their choices, Predict future trends and maintain a competitive advantage.
This reliance on data means that the demand for data analytics professionals continues to expand across diverse sectors, including healthcare, finance, retail, marketing, logistics, and technology.
Businesses use data analytics to gain a thorough understanding of customer behaviour, improve operational efficiency, reduce costs, and identify critical growth opportunities.
Roles And Responsibilities Of Data Analysts
A data analyst is a professional tasked with using the data analytics process to derive these insights, support decisions, and solve problems. A data analyst’s work typically begins by focusing on a specific problem statement.
They avoid the common mistake of starting with a data set and working aimlessly; instead, they establish a clear direction by asking how data can be used to address the stated problem.
For example, when analysing bank statement data, a data analyst would not simply create various “fancy graphs” with no meaning; instead, they would start with a question, such as, “What is the trend of my spending?”. This direction then informs how they visualise the data and tell a cohesive story.
A data analyst’s day-to-day work, particularly in an entry-level position, will most likely involve extensive use of Excel to clean, analyse, and present data. They use tools such as SQL (Structured Query Language), which is required for communicating with databases and retrieving necessary information, particularly when dealing with large data sets.
Analysts use these tools to perform analyses like placing spending on a line graph to track increases and decreases over time or bucketing expenditures into categories like entertainment or food to see spending shifts. Ultimately, the data analyst translates raw numbers into strategic knowledge for the business.
ESTABLISHING A SUCCESSFUL DATA ANALYST JOURNEY: A BEGINNER’S FOCUS

To start a successful career as a data analyst, especially as a newcomer, take a structured, strategic approach that emphasizes hands-on skills, practical projects, and thorough preparation for job applications. This journey can be completed within six months of dedicated self-study if one devotes three to four hours per day to learning.
The recommended strategy is a six-month plan divided into three phases: skills (Months 1-3), projects (Month 4), and job applications (Months 5-6).
Months 1–3: Mastering Foundational Skills
The first three months should be spent concentrating on developing technical skills. Based on current experience, a beginner should focus exclusively on learning just three core tools in this specific order: Excel, SQL, and Tableau.
These three skills are usually sufficient for most entry-level data analyst positions. Learning these first provides enough knowledge to secure a job, while more complex tools such as Python or cloud technology can be learnt later.
1. Excel (Intermediate Level)
Excel is prioritised because it is still the most popular business intelligence (BI) tool across multiple industries, and it is highly likely that a new hire will use it extensively in their first role. VLOOKUP, pivot tables, and visualisation creation are important functions to master.
The best way to learn Excel is by doing. The learning process should be divided into smaller, more manageable chunks, such as one week dedicated to learning formulas and another to mastering visualisations, charts, and graphs. A highly recommended practice method is to analyse personal data, such as a bank statement. This allows the user to answer questions using formulas and visualisations, such as tracking spending trends over time or categorising expenses.
2. SQL (Intermediate Level)
SQL is considered fundamental for a data analyst. Data resides in databases, and SQL is the language used to communicate with these databases to retrieve necessary information. It is a more powerful tool than Excel for dealing with large data sets and quickly combining them for analysis. Crucially, any technical assessment required for a data analyst position will be solely focused on SQL.
To achieve an intermediate level in SQL, a student must master functions such as SELECT, WHERE, GROUP BY, HAVING, JOINs, and window functions. Resources such as DataCamp, Udemy, LinkedIn Learning, and YouTube tutorials are recommended for hands-on, interactive learning that does not require software download.
3. Tableau (or an equivalent BI tool).
Tableau is the visualisation tool recommended for focused study because it is the most frequently mentioned tool in job descriptions.
An intermediate Tableau user should understand how to connect to data, add multiple data sources, and create visualisations using filters. An intermediate Tableau user should understand how to connect to data, add multiple data sources, and create visualisations using filters. Similar to Excel, practice should include using real data, such as importing previously analysed bank statement data to recreate and practice visualisations.
Month 4: Strategically Developing Projects
Month four is entirely devoted to practical application through projects. This stage is mandatory, as projects serve as the primary evidence to show recruiters that the applicant possesses data analysis skills in the absence of formal data work experience. Projects must be strategic to make the applicant stand out during the job search and interviews.
There are three key tips for improving project effectiveness:
Combine Skills: Instead of creating separate projects for Excel only or SQL only, develop three to four projects that combine different tools (e.g., combining Excel and SQL or SQL and Tableau). This approach effectively demonstrates to recruiters that the applicant understands which tool is appropriate for solving different aspects of a problem.
Solve a Problem and Tell a Story: Every project should begin with a problem statement. Avoid starting with a dataset aimlessly. The analysis conducted must solve the initial problem and lead to a clear, narrative insight. Starting with the problem ensures that the visualisations and analysis are focused and meaningful.
Utilize Free Resources: Beginners should use free data sources for their projects, such as Kaggle, Reddit, or data.gov. Additionally, guided projects are available through platforms like Coursera (some of which require payment).
Months 5–6: Mastering the Job Application Process
The final phase entails gathering all necessary materials and practicing for interviews.
Material Preparation: Update your resume and LinkedIn profile to reflect the new skills and projects completed.
Technical Assessment Practice: This is a key focus for months five and six. Nearly every single data analyst job application requires an SQL technical assessment alongside general interviews. Beginners must dedicate enough time to take practice technical tests (such as those found on LeetCode and HackerRank) to ensure readiness for the actual interview process. Focusing on medium- and easy-difficulty questions on these platforms can adequately prepare candidates, as these practice tests are often quite accurate reflections of real-life assessments.
Here is the beginners’ focus presented in table format:
| Phase | Duration | Primary Focus/Goal | Key Skills/Activities to Master | Required Proficiency & Tools |
| 1. Skills | Months 1–3 | Mastering Core Entry-Level Tools | Focus only on three tools in this order: Excel, SQL, and Tableau (or an equivalent BI tool). | Intermediate Level. |
| Excel: Learn how to clean, analyse, and present data; master VLOOKUP, pivot tables, and visualisation. | Excel is the most popular business intelligence tool, and it is highly likely to be used in the first role. | |||
| SQL: Learn how to talk to databases to retrieve information. Master functions like SELECT, WHERE, GROUP BY, HAVING, JOINs, and window functions. | SQL is fundamental, and all technical assessments will be completely focused on it. | |||
| Tableau: Learn how to connect to data, add multiple data sources, and create visualisations with filters. | Mastery of one BI tool means knowing about 80% of others (e.g., Power BI) | |||
| 2. Projects | Month 4 | Creating Strategic Portfolio Pieces | Tableau: Learn how to connect to data, add multiple data sources, and create visualisations with filters. | Projects must demonstrate that you know which tool to use to solve specific problems. |
| Start every project with a problem statement to ensure the analysis solves a problem and tells a clear story. | Avoid aimless analysis by starting with a problem rather than just a dataset. | |||
| Utilize free data sources for practice, such as Kaggle, Reddit, or data.gov. | Projects are mandatory, as they are the primary evidence shown to recruiters in the absence of formal experience. | |||
| 3. Job Application | Months 5–6 | Interview Readiness and Application | Update your resume and LinkedIn profile to reflect newly acquired skills and projects. | Dedicate time to applying for data analyst jobs. |
| Practice technical questions using platforms like LeetCode and HackerRank. Focus on easy and medium difficulty SQL questions. | Nearly every job application requires an SQL technical assessment; preparation is critical to avoid being unprepared. |
5 Things To Avoid As a Fresher
Based on the strategic advice, a beginner should actively avoid these pitfalls to ensure their journey is efficient and successful:
Avoiding a Plan: Do not skip creating a detailed six-month roadmap. Without a clear plan, the journey can become aimless, resulting in getting lost in the process. A structure focusing on skills, projects, and applications is necessary.
Trying to learn too many tools, too soon: Avoid the temptation to immediately dive into advanced topics like Python, cloud technology, or every available BI tool. This overextension dilutes focus. Try entry-level roles, concentrate only on mastering Excel, SQL, and Tableau for the initial three months, and defer complex learning until after the job is secured. For entry-level positions, focus solely on mastering Excel, SQL, and Tableau for the first three months; defer complex learning until after the job is secured.
Skipping the Project Development Phase: Avoid thinking that skills alone are enough. Do not skip Month 4 (Projects), as without practical data work experience, projects are the only tangible evidence available to show recruiters that you know how to perform data analysis.
Starting Projects Without a Defined Problem: Avoid the common mistake of starting with a random dataset and then trying to generate results. This often leads to creating nice-looking graphs that ultimately lack meaning. Always establish a clear first. Formulate a problem statement or question that will guide the analysis and storytelling.
Neglecting Technical Assessment Practice: Avoid being unprepared for interviews. Because almost every data analyst job application includes an SQL technical assessment, failing to practice these questions ahead of time (months 5-6) will severely limit job opportunities. Ensure adequate time is allocated to technical preparation using resources like LeetCode and HackerRank.
Data Analytics Training in Hyderabad
The structured data analytics course at White Scholars Academy in Hyderabad focuses on starting the journey and learning concurrently rather than waiting until all theoretical skills are mastered before beginning applications. Enrolling in this course will eliminate the five things a fresher must avoid (as mentioned above).
White Scholars Training Institute in Hyderabad has built a strong reputation for helping students become industry‑ready in data science and analytics. Their course stands out because of its unique blend of theory, practical projects, and mentorship. Students don’t just learn concepts from books; they apply them to real‑world problems, which builds confidence and practical skills.
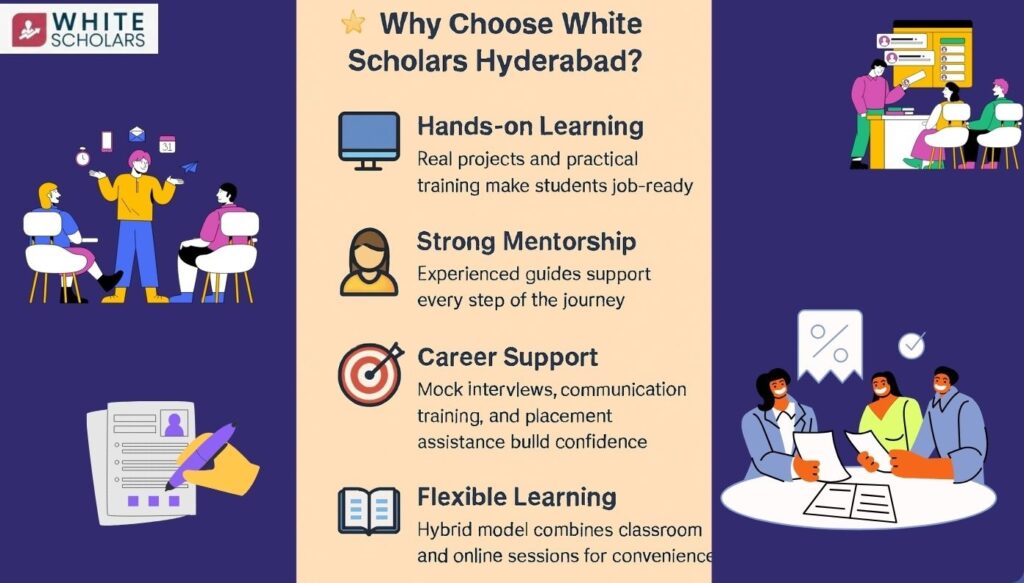
The institute also focuses on communication and interview preparation, something many technical courses ignore. Through mock interviews, group discussions, and presentation practice, students improve their ability to explain ideas clearly, an essential skill for any career. Another highlight is their hybrid learning model, which combines classroom sessions with online flexibility, making it easier for students to balance learning with other commitments.
White Scholars is known for its supportive environment, where mentors guide students step by step and provide placement assistance. This ensures that students learn while also having a clear path to employment opportunities.
In short, choosing White Scholars means getting structured training, hands‑on experience, and career support, all in one place. That’s what makes their course truly special for aspiring data professionals.
Final Thought
The journey to becoming a data analyst is highly achievable within a focused timeframe, provided you adhere to a disciplined, strategic roadmap. The fundamental principle of success is to begin and then learn, rather than waiting until you believe you know everything before taking the first step. A fresher can confidently transition into this in-demand career by focusing on intermediate proficiency in the three core tools (Excel, SQL, and Tableau), developing a portfolio of problem-solving projects, and thoroughly preparing for technical interviews.
Frequently Asked Qestions
What skills should I focus on first in data analytics?
A. Begin with Excel and basic statistics to understand data. Then learn visualisation tools like Power BI or Tableau, and gradually move to Python and SQL for deeper analysis.
Do I need a coding background to learn data analytics?
A. No, coding isn’t required at the start. Beginners can learn step by step, starting with simple tasks and building confidence before moving to Python and SQL.
How can I build a strong portfolio as a beginner?
A. Use free datasets from Kaggle or government portals. To demonstrate your abilities, work on small projects, clearly explain your process, and share the results on GitHub or LinkedIn.
What makes the White Scholars Training Institute in Hyderabad a good choice?
A. They combine hands‑on projects, mentorship, and hybrid learning. With mock interviews and placement support, students gain both technical skills and career confidence.
How do I stay updated and stand out in this field?
A. Follow industry blogs, join online communities, and attend webinars. Keep practicing regularly. Be consistent in your learning and eager to improve.