

The Art of Explaining Insights to Non-Technical Stakeholders
Learn how data analysts explain complex data to non-technical teams using simple language, visuals, and storytelling to drive better business decisions.
Introduction
Have you ever read a report containing a lot of numbers, yet you are confused about what it really means? That is what companies are facing today. Research has found that almost 70% of business leaders are confused about understanding complex data reports. Even if data analysis is strong, it may not have the required impact if it is not presented in a clear manner.
In modern-day companies, data is all around, yet value is achieved only when it is understood. This blog will assist you in learning how data analysts communicate data insights to non-technical audiences in a clear manner. You will gain knowledge about the skills required, tools applied, and methods adopted in real companies. If you are planning to attend a data analytics course in tech hub cities like Hyderabad, Bangalore, Mumbai, etc., then this blog will definitely give you a strong edge in your career journey.
Understanding the Audience Before Presenting Data

Before any data is presented in the form of charts or numbers, the audience is carefully studied. A marketing head, a financial head, or a human resource head does not think in a similar manner to a data analyst or a data scientist. Their focus remains on results, growth, cost reduction, or customer satisfaction.
For example, if sales data is being presented, the business team would not need SQL code. They would like to know the reason why sales have reduced in March or which product has done better. The communication skill is adapted accordingly. Instead of saying “correlation coefficient,” it is explained as “these two factors move together.” This skill is developed in the right data analytics training courses, where both technical and communication abilities are improved.
Breaking Technical terminology into Simple Words
Complicated terms are replaced with easy explanations.
Regression analysis” is explained as “a method used to predict future trends.”
“Data cleaning” is explained as “removing incorrect or duplicate data.”
When freshers join data analyst training, especially in cities like hyderabad, they are not only taught skills like python and sql but also the communication skills. This balance is what companies look for.
Using Visual Storytelling to Make Data Easy
It has been found that people are not influenced by numbers only; however, a story presented in a visually appealing manner can lead to a better understanding of the data. It has been found that the human brain can process visuals 60,000 times faster than text. Therefore, dashboards and charts are preferred over spreadsheets.
A bar chart of last year’s and this year’s sales can be presented in a much more effective manner than a long Excel spreadsheet. Tableau, Power BI, and Google Data Studio are tools that can be used to create interactive dashboards.
In many companies in Hyderabad, data analytics teams present the performance of the company on a monthly basis in a visually appealing manner so that quicker business decisions can be made by the management.
Tools Used for Clear Communication
Some important tools and skills used in this process include
- Excel : data summaries
- SQL : extracting information
- Python (Pandas, NumPy) : analysis
- Power BI and Tableau : dashboards
- Statistics : trend interpretation
- Presentation skills : business meetings
A good data analytics coaching institute usually makes sure that students practice creating dashboards and explaining them in simple terms.
Choose the Right Format for Communication
However, it is not necessary that the information should be communicated in the same way. Sometimes, a simple email summary might be enough, while at other times, a detailed dashboard or a presentation might be necessary. The form that it should be shared in would depend upon the audience and what decision needs to be taken. Hence, choosing the correct format for communication is very important.
For example, senior management might want a one-page summary with key numbers, while team leads might want more detailed reports. The correct format will help save time and ensure that there is no confusion. Once shared in the correct way, it will be easier for others to understand and act upon it.
Use Clear and Simple Language
Data analysts use technical words like “regression,” “correlation,” “variance,” or “machine learning.” However, the same words are not familiar to non-technical stakeholders. Hence, the use of simple words is always recommended.
For example, instead of saying “The predictive model shows a positive correlation,” it can be explained as “Sales are likely to increase when marketing spending increases.” Simple words help build trust and make sure that the stakeholders are able to understand the message without getting confused.
Visualize Your Data for Impact
Numbers alone can feel boring or confusing. A good chart or graph can explain in seconds what paragraphs of text cannot. Visual tools like bar charts, line graphs, and pie charts make trends and comparisons easy to see.
When data is visualized properly, patterns become clear. For example, a line chart showing monthly sales growth quickly highlights peaks and drops. Simple visuals help stakeholders focus on insights instead of struggling with raw numbers.
Numbers are not always exciting. Sometimes they can even get confusing. However, the same numbers can be explained in seconds by presenting them through a chart or graph. A bar chart, line graph, or even a pie chart can help explain the data in the best possible way.
If the data is presented correctly, the patterns can be easily identified. For example, if the data is presented through a line chart, the increase or decrease in sales can be identified quickly.
Keep the Business Question at the Center of All Data Analyses
If data analysis is done without any particular purpose, it would lead to confusion and would not be beneficial. It is always important to remember the purpose of data analysis. Every data analysis process starts with one basic question. What is the business problem that we are going to solve? It is important to remember the purpose of data analysis. It is always beneficial if the purpose is kept in mind while performing the analysis.
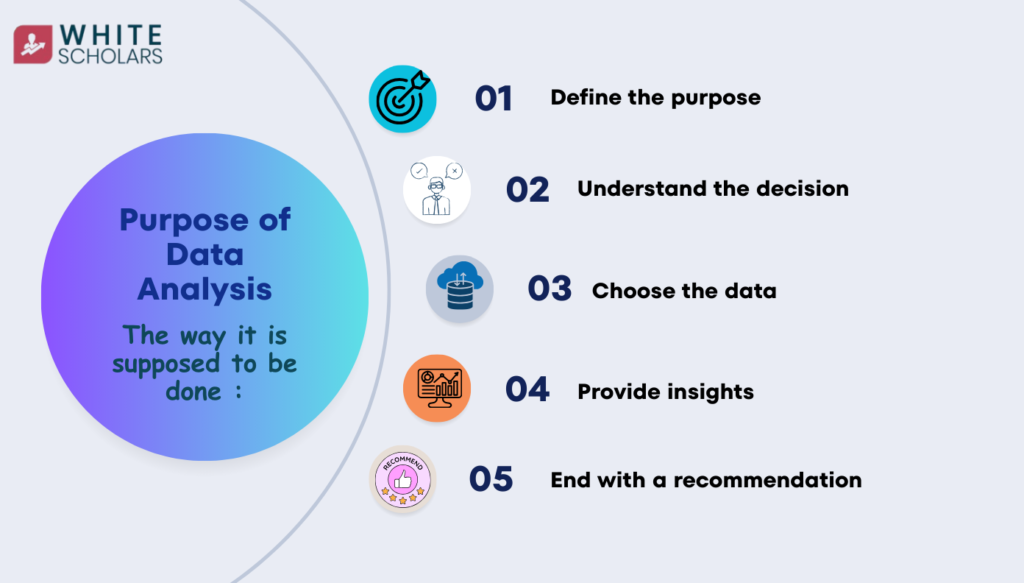
This is the way it is supposed to be done:
- Define the purpose: It is always important to define the purpose before even looking at the data. For instance, “why are sales going down?” is better than “let’s look at the sales data.”
- Understand the decision: It is important to ask what decision is being made. The purpose of data analysis is always to make decisions.
- Choose the data: It is always important to use data that is relevant. It is not necessary to gather data that is not useful.
- Provide insights that are connected with the business impact: At all times, it is vital that the impact on revenue, cost, growth, and satisfaction, among other business-related effects, is explained.
- End with a recommendation: Analysis has to be connected with the next step. It has to be perfectly clear for the stakeholders what the next step will be.
If the business question remains the focus, then the analysis can be meaningful, useful, and applicable.
AI Helps Startups Make Faster Decisions

Startups do not have the luxury of time. They need quick and accurate decisions on a daily basis. AI systems process customer data, website traffic, and sales data automatically.
For example, an e-commerce startup might be able to forecast which products might have more sales next month. Another example is a fintech startup that might be able to identify suspicious transactions immediately.
In cities like Hyderabad, which is growing as a tech hub, many startups use data analytics heavily.
Real-Life Applications of AI in Startups
- Customer Segmentation with the Help of Machine Learning
- Sales Forecasting with the Help of Predictive Models
- Chatbots for Customer Service with the Help of AI
- Recommendation System for Providing Personalized Offers
Students learn Python, the basics of machine learning, and statistical modeling while learning data analytics, which can be helpful in completing all these tasks.
Automation Reduces Costs and Saves Time
It is not always possible for new companies to hire large teams. The use of AI tools is beneficial in the sense that they can carry out repetitive analysis work. The work of data cleaning, report generation, and trend analysis can be done with minimal human interference.
This automation improves productivity. Instead of spending time on generating reports, one can concentrate on the strategy. It is like having an intelligent assistant working behind the scenes.
A structured data analytics course in Hyderabad, Mumbai, or Bangalore can include automation projects. so that learners understand real business use cases.
Tools Commonly Used by Startups
- Python and R: machine learning
- SQL : database management
- Excel: quick summaries
- Power BI and Tableau: dashboards
- Cloud platforms : AWS and Azure
A reputed data analytics coaching institute helps students gain hands-on practice with these tools.
How Freshers Can Prepare for Startup Roles
Startups prefer multi-skilled professionals. Technical knowledge, problem-solving ability, and adaptability are valued highly. Strong basics in statistics, visualization, and coding must be developed.
Internships, live projects, and portfolio building increase job chances. Participation in hackathons also improves practical exposure. A well-structured data analyst course in hyderabad can guide beginners step by step.
Start-ups prefer multi-skilled personnel. Technical Knowledge of the field, problem-solving skills, and flexibility are considered essential skills. Strong fundamentals of statistics, visualization, and coding must be developed.
Internships, live projects, and portfolio development are essential for getting a job. Participating in hackathons is another way of improving practical experience. A well-structured data analyst course helps learners learn every aspect of data analysis.
Bonus Tips and Mistakes to Avoid
- Too many numbers on the slides
- Using technical words without explanation
- Not focusing on the business
- Talking too quickly during presentations
- Do not focus only on theory
- Practice real datasets regularly
- Build a portfolio on GitHub
Consistency is more important than speed. By avoiding these mistakes, the presentation becomes clearer and trust is established.
Turning Insights into Business Actions
Data is of little use if action is not taken on it. After interpreting the data, recommendations are made clearly. For example, instead of saying, “Customer churn rate is increasing,” it is better to say, “Customers who are not active for 30 days should be targeted through retention campaigns.”
This helps the business leaders take action on the data analysis report created by the data analyst.
Communication skills are a must for a data analyst. Students pursuing a data analytics career must practice their presentation skills to improve confidence.
Conclusion
The use of artificial intelligence is affecting the way startups are growing and competing. This is because the analysis, prediction, and processing are being done quickly. This field offers exciting opportunities for freshers. By choosing the appropriate data analytics training, the foundation for a strong career can be established.
FAQ’s
1. Why is communication important for data analysts?
Communication is important, as it helps the stakeholders understand what the data is actually saying. This is because if the data is not communicated properly, even good analysis would not lead to appropriate action.
2. What are the tools that help in presenting data clearly?
Power BI, Tableau, and Excel are some of the tools used for presenting data. These tools help present complex data in an understandable manner.
3. Can freshers learn communication skills as part of the training program?
Yes, communication skills can be learned as part of the training program. There will be presentations and projects, and practice will help improve communication skills.
4. Do non-technical stakeholders require a thorough understanding of the technology and data analysis process?
No, they do not require a thorough understanding. They are more interested in the results and the impact it has on the business. The details of the technology and data analysis process will be explained in a simple way. What they need to know is how it impacts decision-making.
5. Is knowledge of AI necessary for a data analyst?
No, knowledge of AI is not necessary for a data analyst. Knowledge of AI is necessary, but it is not necessary for a beginner. Knowledge of statistics, SQL, and data visualization is necessary for a data analyst.