

Why Power BI and Tableau Reign Supreme in Data Science
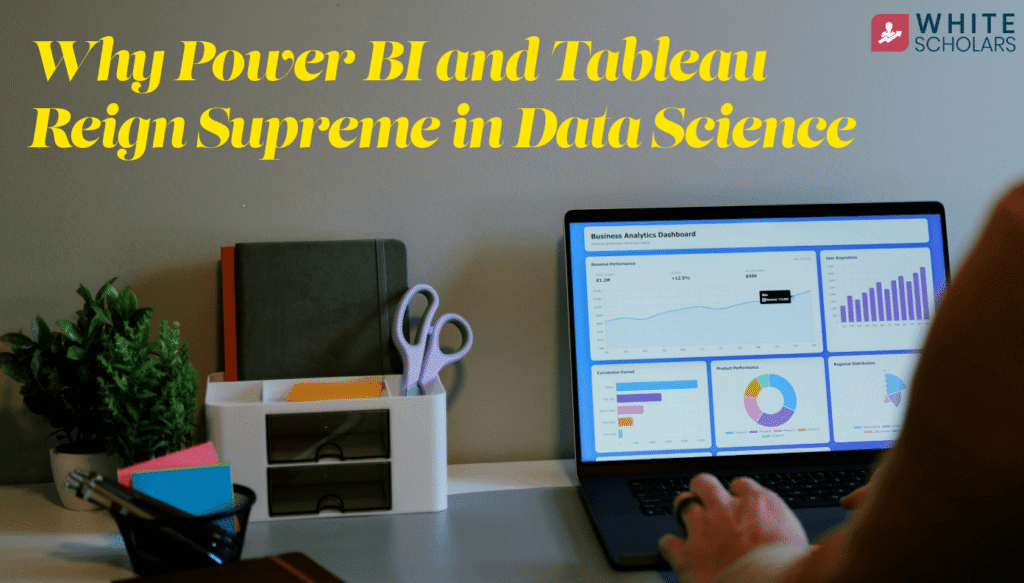
Table of Contents
Discover how Power BI and Tableau dominate Business Intelligence with seamless business integration, advanced visualizations, and AI-driven insights.
Overview
Power BI and Tableau stand as powerhouse business intelligence (BI) tools that transform raw data into actionable insights, driving decisions across industries. These platforms enable data scientists and analysts to create interactive dashboards and visualizations, making complex datasets accessible to non-technical stakeholders.
Core Roles of Power BI and Tableau in BI
Power BI, developed by Microsoft, integrates seamlessly with the Microsoft ecosystem, offering cost-effective analytics for enterprises. Tableau excels in advanced visualizations, handling large datasets with interactive dashboards that support exploratory analysis.
In data science workflows, these tools bridge SQL-extracted data and advanced modeling. They support ETL outputs by visualizing patterns identified in exploratory data analysis (EDA), such as trends in time-series or customer behaviors, before feeding into Python or ML models.
Organizations adopt them for scalability: Power BI serves over 1,00,000 organizations and 30 million monthly users, while Tableau powers 86,000+ firms globally.
Key Features Driving Their Dominance
Power BI holds 13.74% of the broader BI market, used by 97% of Fortune 500 companies. Tableau leads in visualization per Gartner, with strong adoption in data-heavy sectors.
In 2026, BI adoption surges with AI integration, as 78% of organizations use AI in functions, often visualized via these tools. Asia-Pacific, including India, grows rapidly due to digital infrastructure, with millions of data jobs emphasizing BI skills.
Retail using Power BI for sales forecasting across 2,000 stores; finance employs anomaly detection dashboards.
Essential Skills for Data Professionals
Master basics like connecting data sources, creating bar/line charts, and applying filters. Advance to calculated fields, parameters, and dashboard actions.
For data science roles, integrate with Python via SQLAlchemy-fed datasets. Job trends on Indeed and LinkedIn list Power BI/Tableau as must-haves for analysts in Indian tech giants.
Freshers need 80% practical mastery through projects, focusing on interactive dashboards over theory.
Real-World Applications
Healthcare Use Case
Healthcare leverages these for EHR analysis and patient outcomes. Hospitals use Power BI to track appointments: KPIs like satisfaction scores, diagnosis trends, nurse-to-patient ratios, average wait times, and revenue per case.
Visuals include :
- Bar charts for workloads, line graphs for trends, and heat maps for delays.
- Tableau adds pie charts for treatment outcomes and scatter plots for staff efficiency.
- Anomaly detection, displayed in KPI cards
During COVID-19, Tableau dashboards joined vaccination data for recovery rates. Providers forecast outbreaks via ML-integrated visuals, aiding predictive models.
NHS in the UK employs Power BI for incident monitoring and compliance.
Finance and Fraud Detection Use Cases
Financial firms track liquidity, credit risk via Power BI, geo-maps of hotspots and hourly heatmaps for spikes. KPIs: fraud rate, transaction volume, loyalty tier vulnerabilities.
Graphs: sparklines for daily fluctuations, stacked bars for device types, treemaps for risk portfolios. Tableau uses bullet graphs for compliance vs. targets.
- Banks like JPMorgan use Power BI for transaction anomalies:
- Coca-Cola migrated to Power BI for inventory prediction and supply chain optimization.
- Firms achieve ROI through embedded AI for risk assessment.
- Tableau creates compliance reports on balances and trades.
Retail and Customer Insights
Retailers like Target and Tesco use Tableau for segmentation, joining purchases with demographics to predict behaviors, histograms showing customers with 1, 2+ orders.
Visuals: drill-down bar/line charts from national to store-level, geospatial for footfall (63% adoption), combo charts for omnichannel ROI.
Amazon employs Power BI for recommendation engines and inventory forecasting by region. E-commerce optimizes stock via dynamic dashboards, reducing waste.
Walmart switched to Power BI for sales patterns across stores
Marketing and Entertainment Analytics
Marketing segments via Google Analytics exports in Tableau, calculating CAC/ROI. Instagram queries engagement for A/B tests.
Netflix uses Power BI for churn prediction from watch history. Teams build stories with parameters for campaign insights.
Manufacturing and Construction Examples
Construction tracks milestones, budgets, and safety in Power BI, monitoring CO2 emissions for sustainability. Manufacturers spot bottlenecks in production lines.
Tableau visualizes labor productivity and material waste across projects.
Advanced Techniques in Data Science
Use CTEs in underlying SQL, then pivot in Tableau for matrices. Power BI’s DAX for custom measures like running totals.
Spark SQL integration scales to big data; AI visuals auto-detect insights. Blend data sources for hybrid analysis.
Best Practices for BI Mastery
Use aliases, LIMIT for testing, EXPLAIN plans. Materialized views cut costs; version control dashboards.
Design for mobile; add tooltips for interactivity. Validate with stakeholders.
Why Data Roles Are Magnetic
Data science tops in-demand careers in India, leveraging logic and programming. Entry roles like BI developer need SQL, Excel, Python, Power BI/Tableau, learnable via focused courses.
Market growth hits steep rates through 2030.
WhiteScholars: Your Gateway to BI and Data Science
WhiteScholars Data Analytics Course in Hyderabad covers Power BI/Tableau from basics to advanced: interfaces, visualizations, dashboards, LOD, Alteryx integration.
Hands-on projects build portfolios; mentorship from pros. For deeper ML, their Advanced Data Science Course adds Python, stats, Generative AI.
Beginner-friendly, with SQL, ETL, capstones. Flexible learning suits freshers.
Career Acceleration with WhiteScholars
Overcome first-job hurdles: resume support, LinkedIn tweaks, interview prep, hiring connections. Transition B.Tech to junior analyst/data scientist quickly.
Roles like BI developer, ML trainee await, with high pay in India’s engineering market through 2026.
Power BI and Tableau: Your BI Superpowers
Power BI and Tableau remain indispensable business intelligence tools, transforming raw data into interactive visualizations that drive strategic decisions across healthcare, finance, retail, marketing, and manufacturing.
By mastering KPIs like fraud rates, CLV, and downtime percentages, visualized through DAX measures, LOD expressions, bar charts, heatmaps, treemaps, and dynamic tables. These platforms empower data professionals to uncover patterns and deliver real-time insights at scale.
These tools power insights from healthcare to retail, essential for 70%+ data jobs. Master via projects, integrate with Python/Tableau dashboards for employability.
In 2026, as India’s data science market surges toward millions of jobs by 2030, proficiency in these tools tops job requirements on platforms like LinkedIn and Indeed, often paired with SQL and Python for end-to-end workflows. Their AI integrations, like natural language querying in Power BI and predictive visuals in Tableau and ensure enduring relevance amid exploding data volumes, making them gateways to high-paying roles such as BI developer, data analyst, or junior data scientist.
In 2026’s data explosion, their AI evolutions ensure relevance. Build pipelines, showcase expertise.
Elevate with WhiteScholars’ hands-on training, Power BI/Tableau sessions through WhiteScholars data science and data analytics course. BI isn’t just tools, it’s your data impact edge.
FAQ’s
What are the main differences between Power BI and Tableau?
Power BI integrates seamlessly with Microsoft tools and is cost-effective for enterprises, while Tableau excels in advanced, interactive visualizations for exploratory analysis on large datasets.
How are Power BI and Tableau used in real-world industries like healthcare and finance?
In healthcare, they track KPIs like patient wait times and diagnosis trends via bar charts, heat maps, and anomaly detection; in finance, they monitor fraud rates, transaction volumes, and risk with geo-maps, sparklines, and bullet graphs—examples include NHS using Power BI and JPMorgan for anomalies.
What essential skills do data professionals need to master Power BI and Tableau?
Start with basics like data connections, charts, and filters; advance to calculated fields, DAX/LOD expressions, dashboard actions, and integrations with SQL/Python—focus on 80% practical projects for freshers targeting analyst roles.
Why are Power BI and Tableau in high demand for data science jobs in India?
They top requirements on LinkedIn/Indeed for roles like BI developer or junior data scientist, especially with AI integrations; India’s market surges with millions of jobs by 2030, paired with SQL/Python for scalable insights in retail, marketing, and more.
How can WhiteScholars help beginners learn Power BI and Tableau?
Their Data Analytics Course in Hyderabad offers hands-on training from basics to advanced visualizations, dashboards, Alteryx integration, and projects; includes career support like resume tweaks and interview prep for quick transitions to high-paying roles.