

How to Collect, Organize, and Prepare Data for Accurate Analysis

Incorrect data leads to bad decisions, simple as that.
A business can have the best analysis tools out there, but if the data going in is messy, incomplete, or wrong, the results coming out won’t mean much either. This is why proper data collection and preparation matter so much, way before actual analysis even starts.
A lot of businesses jump straight to analysis. They think this is the only necessary thing. But the truth is, most of the actual effort goes into collecting and cleaning data properly first. Skipping this stage can lead to inaccurate conclusions, no matter how advanced the analysis tool is.
In this blog, we’ll go through how you can collect, organize, and Prepare Data for Accurate Analysis part actually gives you accurate, useful results.
Step 1) Define the Aim of Your Research
Know exactly why you are collecting data before you collect any data at all. Many people begin by gathering numbers and data with no goal in mind, and end up having a lot of data that doesn’t even address their real question.
So, first write out what you’re really trying to find out.
- Are you checking customer satisfaction?
- Trying to find sales trends?
- Looking for a specific trait or behaviour towards a change?
Whatever it is, be specific.
One step saves you a lot of time later on. Knowing your purpose allows you to know exactly what data you need and what to ignore. Otherwise, you collect lots of extra useless information and still don’t get the actual information you needed for your real question.
Step 2) Collect Data Carefully
With your goal in mind, the next step is to actually collect the data. But this needs to be done carefully, and not just by grabbing whatever you can find.
Always make sure the data you collect Prepare Data for Accurate Analysis, whether from surveys, customer records, sales figures, or online forms, is accurate and up to date. If the source data is outdated or incorrect, it can affect the accuracy of everything that follows.
Also, be consistent in how you collect it. If you’re using a form, make sure everyone fills it out the same way, with the same units and the same format. Mixing formats halfway through the collection creates a mess later when you try to put it all together for analysis.
Step 3) Consolidate Data into a Single Form
Data comes from many sources, and not all of it is in a consistent format. Some exist as paper documents, handwritten survey forms, screenshots of reviews or comments, or printed reports. So you have to convert all that data into a digital form.
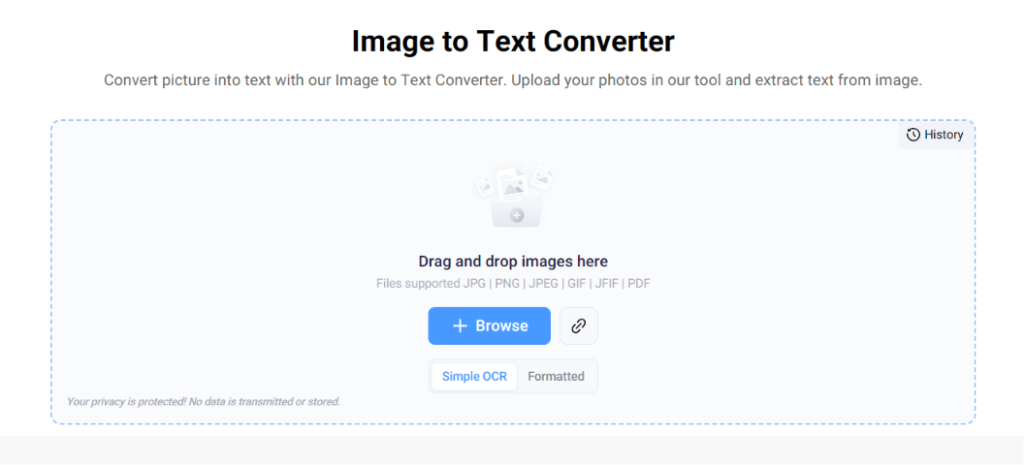
Here, an OCR tool helps a lot. Such tools are easily available online. They can process multiple images at once. The following picture shows the interface of one such tool:
(Source Link: https://www.imagetotext.io/)
You just upload the images or screenshots containing important information. And the tool will take a couple of seconds to extract editable text from it. No need to type everything by hand.
For text-based data, use a reliable text editor like MS Word or Google Docs. For tabular data, Excel and Google Sheets work best. They help keep everything structured rather than scattered across different files and formats.
Step 4) Clean and Validate the Data
Once everything is in one digital form, the next step is cleaning it up. Raw data almost always has some mess in it: duplicate entries, missing values, wrong formatting, and even typos.
Go through the data and remove duplicates first. Check for missing values too, and decide if you need to fill them in or remove that row completely. It depends on how important that data point is.
Also, validate the data. Check if the numbers actually make sense. A sales figure that looks way too high or too low compared to others might be a typing error, not real data.
Step 5) Organize the Dataset for Easy Analysis
Once your data is clean, put it into a structure that’s easy to work with. Use proper column headings, keep similar data types together, and sort rows in some logical order, by date, category, or whatever fits your data best.
Group like data together. Do not put data in different sheets or files. That makes it easier to use formulas, create charts, or filter data when you actually start to analyze.
A well-structured dataset will save you a lot of time later. This way, you will spend less time searching for things and more time actually working on the analysis part.
Step 6) Transform Data into an Analysis-Ready Format
The last thing before you actually analyze your data is to get it into the right shape for it. Standardize things first. Like dates in one format and currencies and measurement units consistent throughout.
Create calculated fields as well, where necessary. For instance, if you need to calculate totals, averages, or percentages, having calculated fields will save you from doing those calculations manually every time you analyze the data.
Finally, ensure that your data format is compatible with the analytics or BI tool you plan to use. Some tools require certain file types or structures, so check this out before you get started to avoid compatibility issues later on.
Final Words
So these are the 6 steps that take you from raw, scattered data to something actually ready for analysis. Skipping any of these steps usually shows up later as wrong conclusions, messy reports, or numbers that just don’t add up. A bit of extra effort at this stage saves a lot of trouble during actual analysis.
Follow these steps properly, and whatever analysis you run afterward will actually give you results you can trust.
